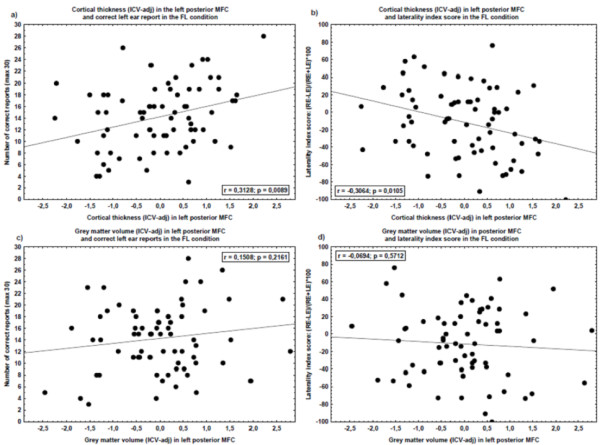
Figure 3.

Scatterplots. The scatter-plots show measures of grey matter of left posterior middle frontal cortex (MFC) (x-axes) and performances on the forced left (FL) condition (y-axes). Each dot represents one subject. The left posterior MFC volume and thickness measures are reported as standard residuals after the influence of intra-cranial volume (ICV) was removed (linear regression). The two scatter-plots above show the cortical thickness in the left posterior MFC to a) number of correct left ear report on FL condition (left scatter-plot), and b) a laterality index score ((RE-LE)/(RE+LE)*100) in the FL condition (right scatter-plot). The two scatter-plots below show the grey matter volume in the left posterior MFC to c) number of correct left ear report on FL condition (left scatter-plot), and d) a laterality index score ((RE-LE)/(RE+LE)*100) in the FL condition (right scatter-plot).
