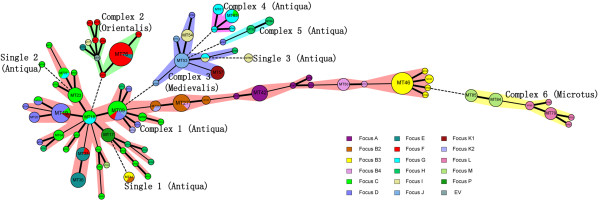
Figure 2.
Minimum spanning tree analysis. A minimum spanning tree was constructed using the genotyping data provided in figure 1. In the minimum spanning tree the MLVA types are displayed as circles. The size of each circle indicates the number of isolates with this particular type. Thick solid lines connect types that differ in a single VNTR locus and a thin solid connects types that differ in 2 VNTR loci. The colors of the halo surrounding the MLVA types denote types that belong to the same complex. MLVA complexes were assigned if 2 neighboring types did not differ in more than 2 VNTR loci and if at least 3 types fulfilled this criterion.

