Figure 3.

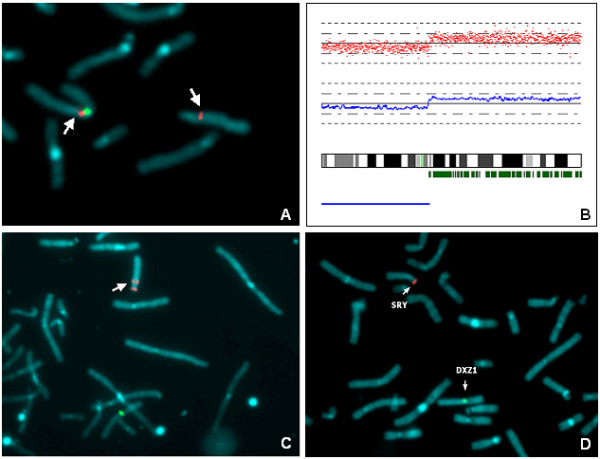
Molecular-cytogentics analysis of X and Y chromosome breakpoint. Partial metaphase plate after FISH with RP11-368D24 probe (Xq11.1). The signal (red) was detected both on der(Y) and X chromosome (arrows). CEP X probe (Cytocell, green) was used to identify X chromosome (A). Location of disomic SNP calls (small green vertical bars) is shown along the long arm of X chromosome ideogram. The blue bar below the ideogram indicates the region of monosomy. In the upper histogram the log2 intensity ratio for each SNP locus (red dots) is represented and the blue line below shows the averaged log2 values. Breakpoint is localised between SNP_A-1753661 (nt.68.182.937) and SNP_A-1659250 (nt.69.788.317) in Xq13.1(B). There is a discrepancy between the results obtained through FISH using BAC probes and Affymetrix® analysis of SNPs on X chromosome (A, B). Partial metaphase plate after FISH with RP11-65G9 (Yq11.223) probe. The signal (red) was detected on der(Y) (arrow). LSI SRY SpectrumOrange/CEPX Spectrum Green probe (Vysis, Abbott Molecular, Illinois, USA) was used as control probe (C). Dual-color FISH analysis on chromosome spreads (partial metaphase) with LSI SRY SpectrumOrange/CEPX SpectrumGreen probes. Arrows: normal and derivative chromosome showed specific hybridization signals that are localised correctly (D).
