
FIG. 2. Augmented SPW-R activity and normal theta wave activity in area CA1 of the mutants.
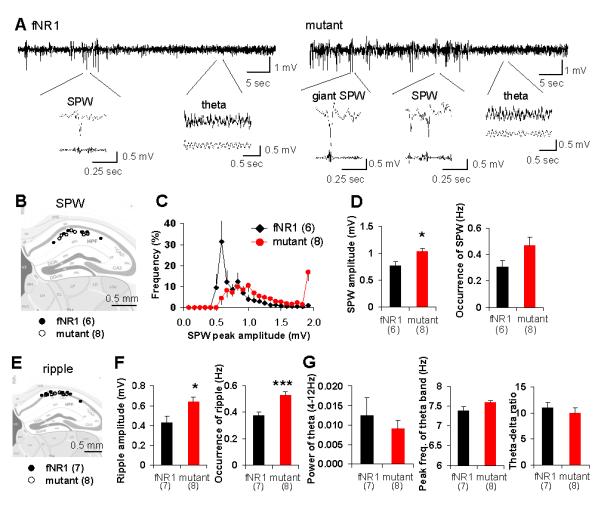
(A) Representative LFP traces including theta and SPW-associated periods in fNR1 (left) and mutant (right) mice recorded from CA1 stratum radiatum. Typical traces of theta waves, ‘conventional’ SPWs and ‘giant SPWs’ are magnified below. LFP signals were filtered at 80-250 Hz to detect ripples and at 5-12 Hz to detect theta waves.
(B) Location of individual electrodes implanted in CA1 stratum radiatum for SPW analysis.
(C) Distribution of the peak amplitude of SPW in fNR1 control (black rhomboid) and mutant (red circle) mice. Strikingly, mutants showed clear bimodal distribution of SPW peak amplitude. Events with peak amplitude exceeding 1.8 mV were defined as ‘giant SPW’, which appeared only in mutants.
(D) The amplitude (left) and the occurrence (right) of conventional SPW in fNR1 and mutant mice during SPW-associated periods. Mutants displayed higher amplitudes (Student’s t-test, *P<0.05) and increased tendency towards ‘conventional’ SPWs (Student’s t-test, P=0.09).
(E) Location of individual electrodes implanted in CA1 stratum pyramidale for ripple analysis.
(F) The amplitude (left) and the occurrence (right) of ripples in fNR1 and mutant mice during SPW-associated period. Ripple amplitude and occurrence in mutant mice were higher than in fNR1 controls. Student’s t-test, ***P<0.005, *P<0.05.
(G) Power (left) and peak frequency (middle) of theta oscillations and theta-delta ratio (right) are shown. Theta/delta ratio was defined as power in the theta peak frequency range (5-10 Hz) divided by power in the delta peak frequency range (2-4 Hz). No significant differences in theta properties were observed between fNR1 and mutant mice, suggesting normal theta activity in mutants. Black bar, control mice; red bar, mutant mice. Number in parentheses indicates the number of animals.