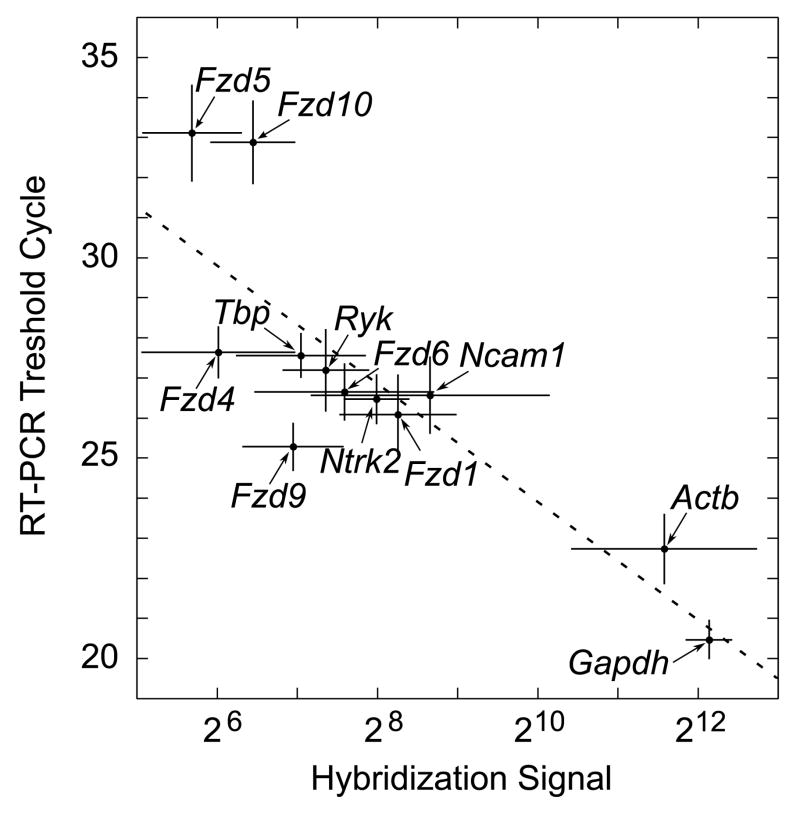
Fig. 5. Correlation of microarray and real-time RT-PCR analyses of Wnt-receptor expression within the cochlea.
The hybridization signals are from the meta-analysis of our microarray data and those of Someya and colleagues (Table 2 and Supplement Table 1). The RT-PCR threshold cycles are the means from the modioli of twelve separate, nine-week-old animals. The Pearson’s coefficient for the fitted straight line equaled −0.84, indicating a significant correlation (P < 0.001). Error bars, standard deviations; gene symbols, see Table 1.

