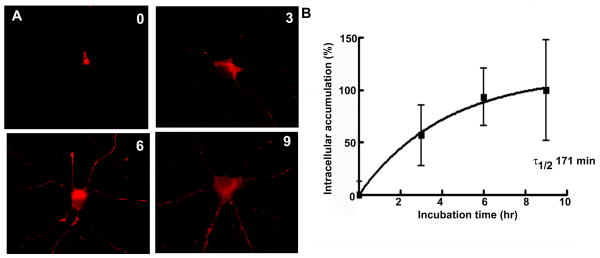
Figure 2. Intracellular accumulation of the δ subunit peaked at 6 hr.
A- Intracellular accumulation of the δ subunit was studied with a longer incubation period. Minimal background intracellular fluorescence for the δ subunit was observed at 0 hr. A gradual increase in the fluorescence intensity and immunoreactive area was observed over a period of 3–9 hr, indicating intracellular accumulation of the δ subunit.B- Intracellular accumulation of the δ subunit was plotted as a function of time (n=21–40 cells per time point from 5 experiments). The line was best fit to an equation for single phase exponential association.

