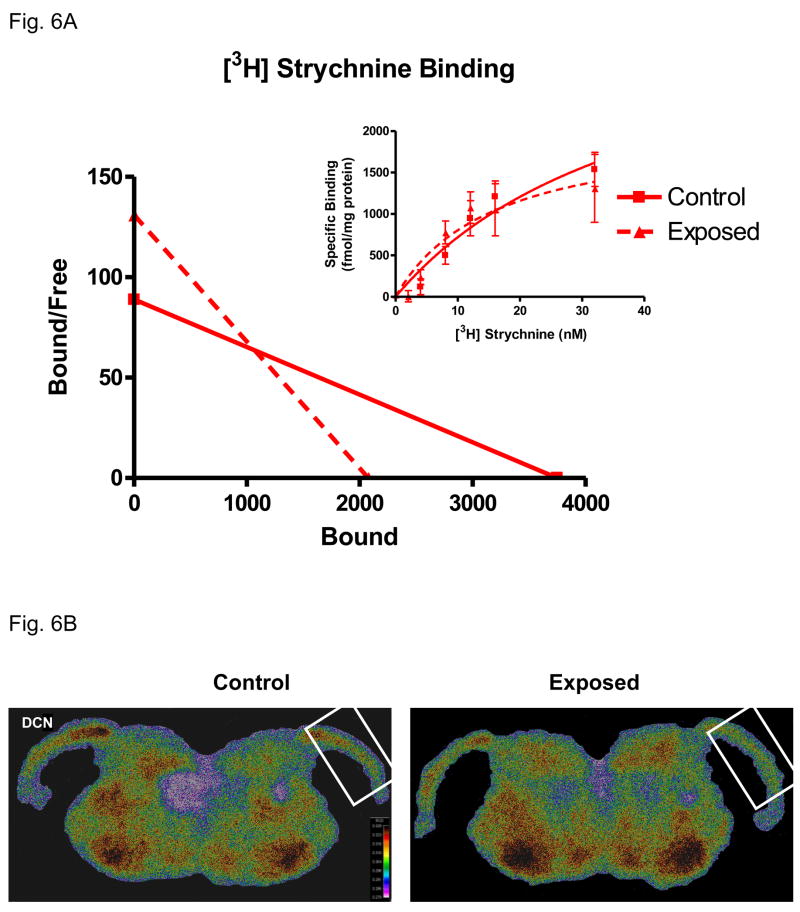
Figure 6.
Exposure-related changes in strychnine binding between adult control and exposed FBN rats. Fig. 6A: Representative scatchard plots of [3H] strychnine binding in DCN from the control and exposed groups. A significant exposure-related loss of strychnine binding sites (X intercept = Bmax; Slope = Kd) is seen in exposed rats while a lower Kd suggests higher affinity in exposed rats (ρ < 0.05, 4 control, 4 sound-exposed). Fig. 6B: Color enhanced digitized images showing strychnine binding change in DCN between control and exposed rats. Ipsilateral DCNs were framed and the warmer colors indicate higher levels of binding.

