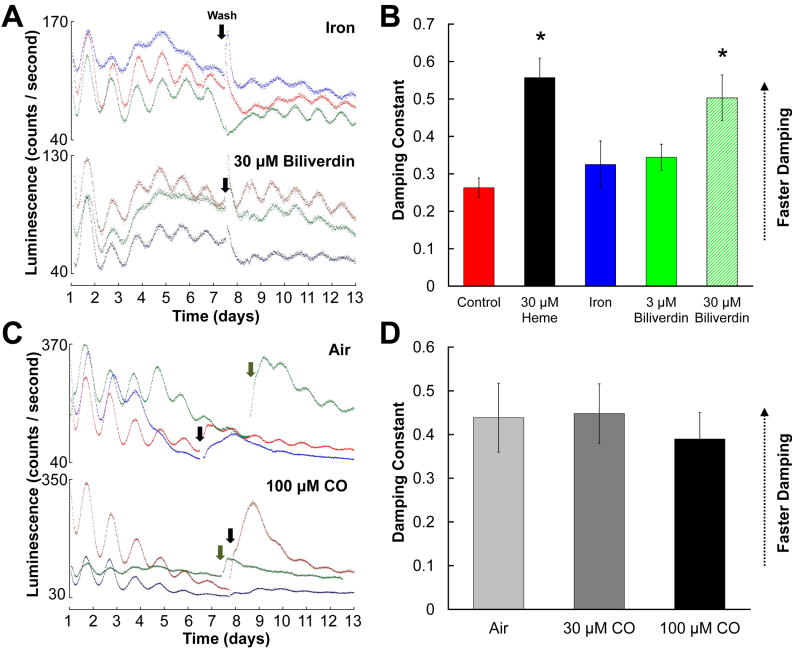
Figure 6.
Effects of heme metabolites on SCN PER2∷LUCIFERASE rhythms. A, C, Representative raw luminescence traces for SCN cultures treated with 30 μM iron or 30 μM biliverdin (A) or with air or 100 μM carbon monoxide (C). B, D, Mean damping constants for SCNs treated with iron or biliverdin (B) or with air or CO (D) as indicated in figure keys. In B, data for control and 30 μM heme groups are repeated from Fig. 1. (*, significantly different from controls, p < .05)

