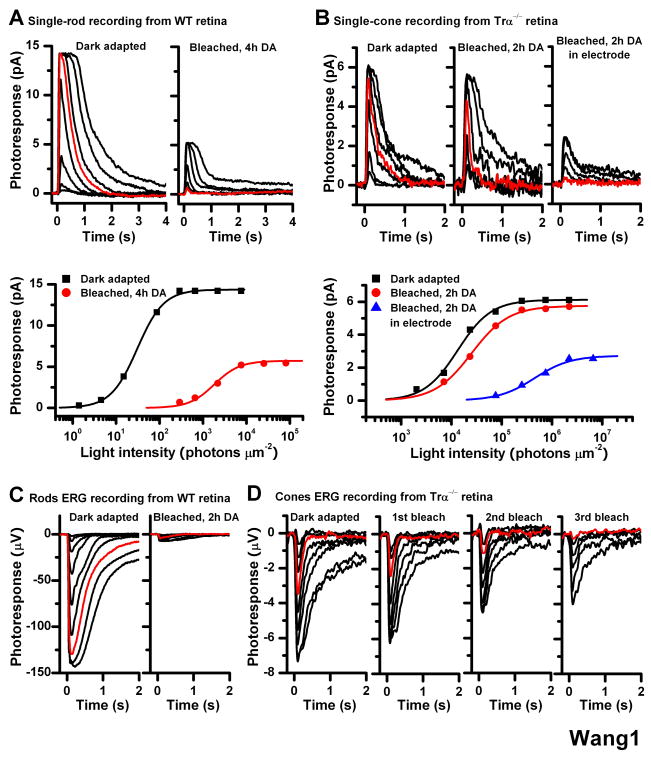
Figure 1.
Effect of bleach on rod and cone single-cell responses in isolated mouse retina Single-cell suction recordings of flash intensity-response families from rods of wild type mice (A) and cones of Trα−/− mice (B). Top panels show test flash responses from individual cells recorded in dark-adapted state (left) or following a 40-s 500 nm light bleach and 4-h (rod) or 2-h (cone) dark recovery period (right). Right-most panel in (B) shows responses from a cone that was bleached and held in the recording electrode during the dark recovery period. Here and in all subsequent figures, photoresponses were generated by 20-ms test flashes delivered at time 0 and of intensity increasing in 0.5 log unit steps. Red traces represent photoresponses to 291 photons μm−2, 500 nm for rods (A) and to 75,814 photons μm−2, 500 nm for cones (B). Bottom panels show the corresponding intensity-response relations for these cells, fit with Michaelis-Menten function R/Rmax = I/(I+IO), where R/Rmax is the normalized response amplitude, I is the flash intensity, and IO is the intensity required to produce half-saturating response. The desensitization produced by the bleach was persistent in rods but largely reversed in cones from isolated retina in the absence of pigment epithelium
(C) Rod ERG responses from isolated wild type mouse retina in darkness (left) and following a bleach and 2-h dark recovery period (right). Red traces represent photoresponses to 1,977 photons μm−2 500 nm
(D) Cone ERG responses from Trα−/− retina in dark-adapted state (left) and after each of three subsequent bleaches, followed by dark recovery period (right three panels). The substantial desensitization induced by the bleach was persistent in rods but was largely reversed in cones
Methods: Mice were dark adapted overnight, euthanized by CO2 asphyxiation, and the eyes enucleated under dim red light. Under infrared light, the eyeballs were hemisected, and the retinas were removed and placed in L-15 medium saturated with pure oxygen. To block Müller cells function, prior to isolating the retina the eyecup was incubated with 10 mM L-α-AAA dissolved in L-15 medium, pH 7.4, for 2.5 h in oxygen-saturated chamber at room temperature. Single-cell suction recordings for rods and cones were done as described previously [9, 19]. Rod and cone electroretinogram (ERG) photoresponses from isolated mouse retina were done as described previously [8, 20, 21]. By pharmacologically blocking synaptic transmission (see Supplemental Experimental Procedures), we recorded the photoreceptor component (a-wave) of isolated retina ERG responses. Test flashes at 500 nm were delivered from an optical bench using a set of calibrated neutral density filters. The signals were amplified, low-pass filtered at 30 Hz (8-pole Bessel) and digitized at 100 Hz for further analysis. Flash sensitivity was calculated from the linear region of the intensity-response curve as the ratio of response amplitude and flash intensity.

