Fig. 3.

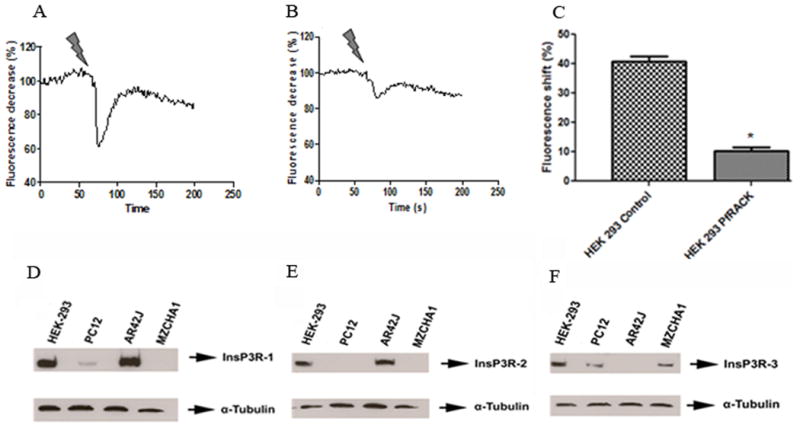
(a-c) Cells were loaded with fura-red and caged InsP3, then monitored by confocal microscopy as InsP3 was uncaged by two-photon flash-photolysis. Typical tracings of the InsP3-induced Ca2+ signal in (a) a non-transfected control cell and (b) a cell expressing GFP-PfRACK. (c) Summary shows the peak amplitude of the InsP3-induced Ca2+ signal is reduced (*p<0.001) in cells expressing GFP-PfRACK. Values are mean±SEM of triplicate measurements made of >40 cells under each condition. (d-f) Expression of InsP3R isoforms in different cell lines. Blots for (d) type I, (e) type II, and (f) type III InsP3R show that PC-12 cells express types I and III but not type II InsP3R, AR4-2J cells express types I and II but not type III InsP3R, and Mz-Cha-1 cells express only type III InsP3R. HEK293 cells express all three isoforms.
