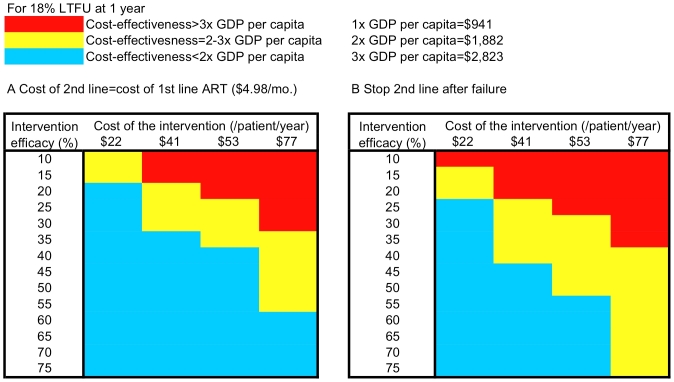
Figure 2. Sensitivity analysis on cost and efficacy of interventions to prevent LTFU with 18% baseline LTFU.
(A and B) Represent the cost-effectiveness of LTFU prevention strategies as a function of cost (columns) and efficacy (rows). (A) Illustrates the scenario where the cost of second-line ART is decreased to the cost of first-line ART (US$4.98/month, excluding patient co-payment). (B) Shows the scenario of stopping second-line ART after failure instead of continuing ineffective therapy. The light blue areas represent combinations of cost and efficacy of LTFU prevention strategies under each ART cost composition that ensure cost-effectiveness of LTFU strategies below 2× per capita GDP. The yellow area represents combinations of cost and efficacy of LTFU interventions that produce cost-effectiveness ratios between 2× and 3× per capita GDP. The red area represents scenarios where the cost-effectiveness ratios of LTFU interventions exceed 3× per capita GDP.

