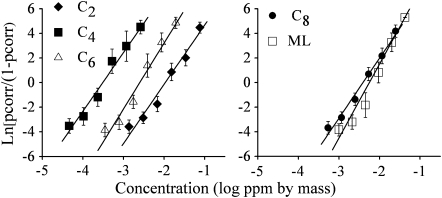
Figure 2.
Psychometric functions for single (unmixed) compounds. y axis: the log-odds ratio of chance-corrected pcorr. x axis: stimulus concentration in log ppm (by mass). The lines represent best-fit linear functions (least-squares regression). The functions for ML and octanoic acid (C8) are depicted on a separate graph for clarity.

