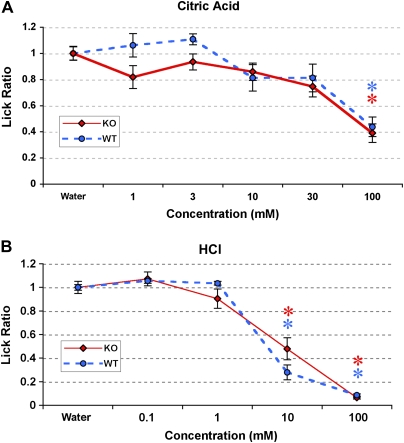
Figure 3.
(A and B) Brief-access lickometer responses of P2X2/P2X3Dbl−/− and WT control mice to sour substances. Asterisks denote values significantly different from 1.0. Stacked asterisks indicate that values for both KO and WT are significantly different from 1.0. (A) KO (n = 7) and WT (n = 6) mice avoid citric acid at 100 mM (P < 0.001). (B) Both KO (n = 5) and WT (n = 5) mice avoid HCl at 10 and 100 mM (P < 0.001). This figure appears in color in the online version of Chemical Senses.

