Figure 8.

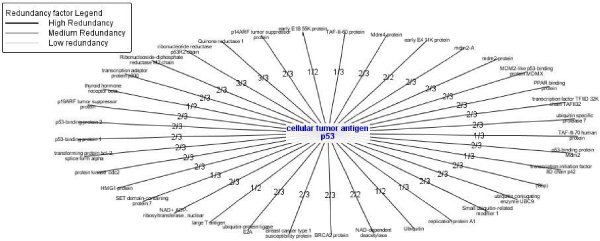
Redundancy analysis example. Redundancy analysis hypergraph of the "cellular tumor antigen" p53 network. The redundancy of ribonucleotide reductase p53R2 chain is the highest possible, and we will expect a high interaction probability.

Redundancy analysis example. Redundancy analysis hypergraph of the "cellular tumor antigen" p53 network. The redundancy of ribonucleotide reductase p53R2 chain is the highest possible, and we will expect a high interaction probability.