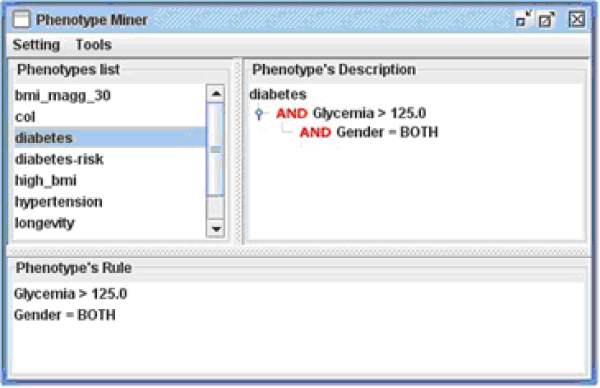
Figure 6.

Phenotype Editor main panel. The main panel of the Phenotype Editor, showing phenotype definitions represented as a logical tree model. The top left frame contains the list of phenotypes defined so far, the top right frame shows the logical definition of the selected phenotype, and the bottom frame displays the same definition in textual form.
