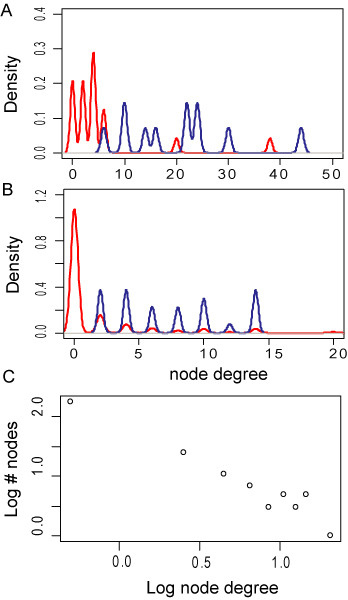
Figure 4.
Degree distributions of patient and molecular networks. Bipartite modularity maximization guided by Markov Clustering algorithm determined a subgroup of patients (panel A) that hat highly increased node degrees (blue line) as compared to the remaining patients (red line). The associated molecules found in the same cluster (blue line, panel B) featured the same increased node degree. The node degree of the molecular analytes was found to follow a power law distribution (panel C).

