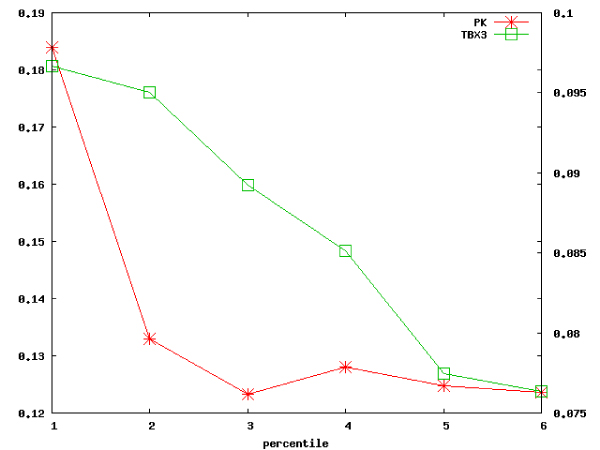
Figure 2.

Protein pairs closeness in the PPI network. The plot shows the fraction of protein pairs that are close to each other in the PPI network (d ≤ 3, see the text for details) respect to all the protein pairs within the considered percentiles of the ranked genes lists regarding the case studies of PK (asterisks, left scale) and TBX3 (squares, right scale).
