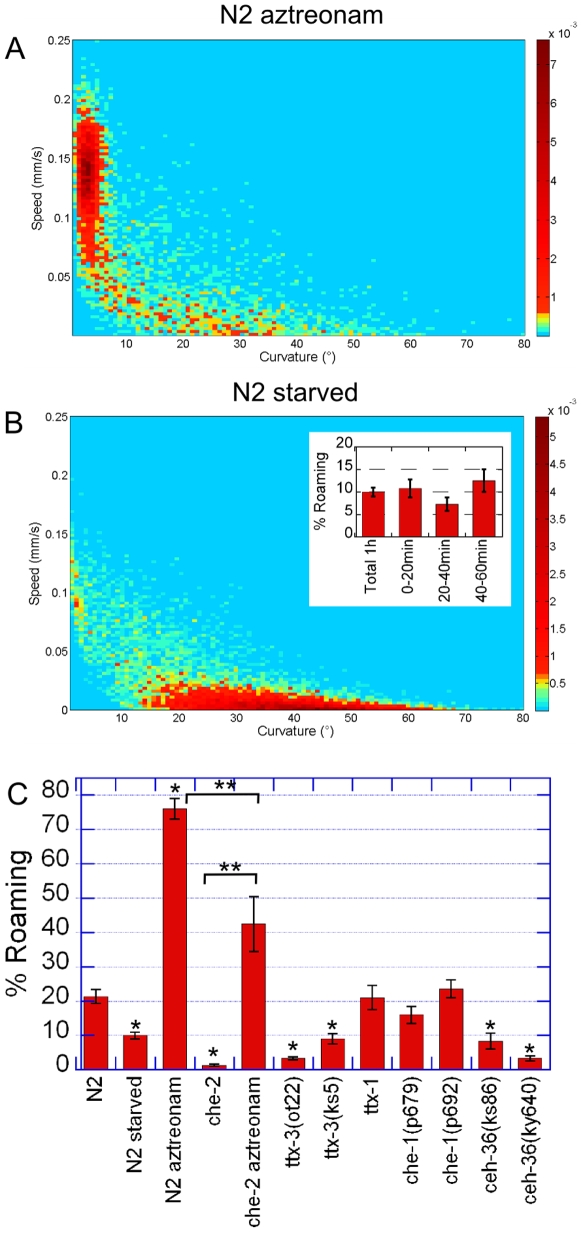
Figure 3. Influence of food perception and experience.
(A–B) Data density maps for (A) N2 worms feeding on aztreonam treated bacteria. Compared to N2 worms in standard conditions (Fig 1-D) the dwelling cluster is suppressed (B) N2 worms feeding on standard OP50 bacteria after a 1 h fasting period. The roaming cluster is suppressed. Insert: Proportion of time spent roaming during the 0–20 min, 20–40 min and 40–60 min time intervals after a one-hour starvation period. (C) Quantitative measurements of the percentage of time spent roaming of N2 worms in aztreonam (A) and fasting (B) conditions and of mutants that have sensory perception defects. At least 20 worms were recorded per condition. Results are presented as mean ± s.e.m. *Different from wild type, p<0.01 **Different from each other p<0.01.

