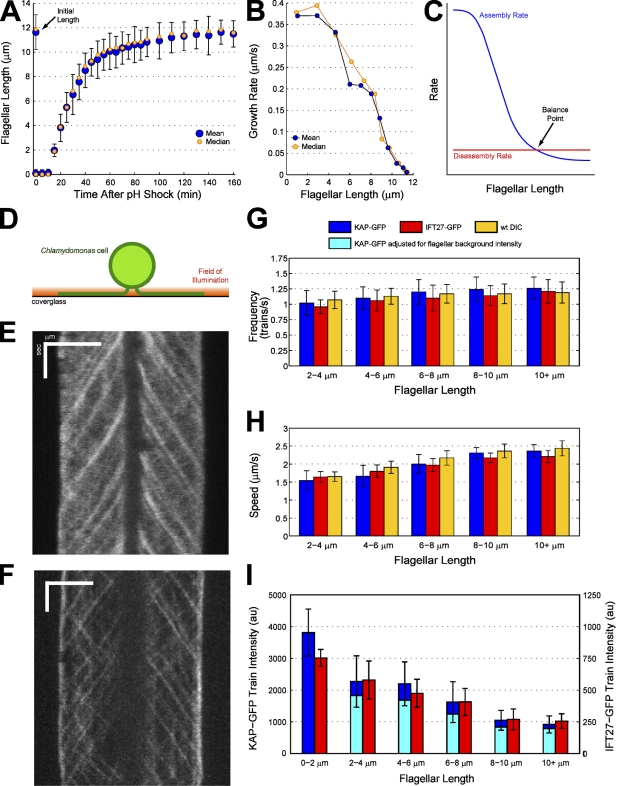
Figure 1.
During flagellar regeneration, there is an inverse relationship between IFT train size and flagellar length. (A) The kinetics of regeneration after pH shock. n for all time points combined = 2,026 flagella. (B) The growth rate of regenerating flagella decreases as a function of length. (C) The balance-point model predicts that equilibrium will be reached between a length-independent disassembly rate and an assembly rate that decreases as a function of length. (D) The setup for imaging C. reinhardtii flagella via TIRF. (E and F) Kymographs of KAP-GFP (E) and IFT27-GFP (F) cells undergoing regeneration after pH shock, generated from Videos 1 and 2. Bars: (horizontal) 5 µm; (vertical) 1 s. (G–I) The frequency (G), speed (H), and average (I) intensity of IFT trains during pH shock regeneration, binned by flagellar length. The intensities of IFT traces were normalized by either camera noise (dark blue and red bars) or background flagellar intensity (light blue bars). n for all time points = 113 KAP-GFP flagella, 97 IFT27-GFP flagella, and 97 wild-type (wt) flagella imaged by DIC. Error bars indicate standard deviation.

