Figure 2.
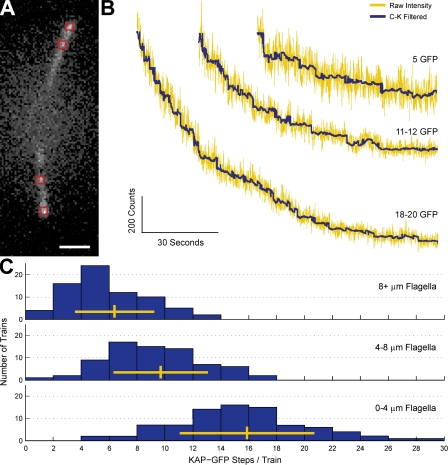
Quantitative photobleaching confirms that IFT trains in short flagella contain more KAP protein. (A) At different time points after pH shock, KAP-GFP cells were for fixed and photobleached under constant TIRF illumination. The mean intensity was measured from 0.4 × 0.4 µm ROIs (red squares) centered on IFT trains. Bar, 2 µm. (B) Three examples of intensity plots of ROIs from flagella of different lengths. The raw data were filtered with a Chung-Kennedy edge-preserving algorithm to enhance the detection of stepwise GFP bleaching events. (C) Histograms of the number of KAP-GFP proteins measured in ROIs from long, mid-length, and short flagella (yellow vertical bars denote the mean, yellow horizontal bars show the standard deviation). n = 230 ROIs from 90 flagella.

