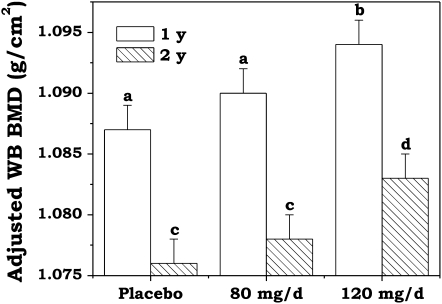
FIGURE 2.
Mean (±SEM) whole-body (WB) bone mineral density (BMD) values by supplementation group, with 1- and 2-y outcomes as the dependent variable, according to a general linear model with adjustment for study site, soy protein intake, and pretreatment values. Letters above the columns at 1 y (placebo: n = 128; 80 mg soy isoflavones/d: n = 122; 120 mg soy isoflavones/d: n = 123) and at 2 y (placebo: n = 126; 80 mg soy isoflavones/d: n = 119; 120 mg soy isoflavones/d: n = 117) denote differences between the treatment groups where a and c = placebo compared with 80 mg/d (P > 0.05) and b and d = placebo compared with 120 mg/d (P < 0.05).

