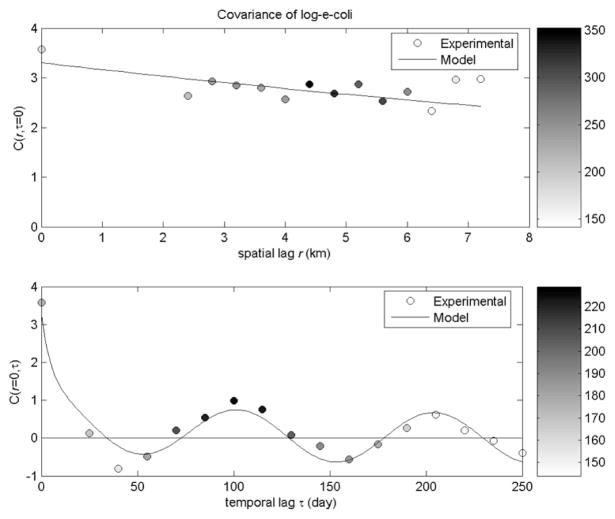
Figure 2.
The spatial, cX(r,τ =0), and temporal, cX(r=0,τ), components of the covariance model for E. coli (EC), where a nugget effect was removed for EC (0.27 logFIB/100 ml)2 to account for measurement error. The color bars to the right shows the number of pairs of measurements used to calculate the corresponding experimental covariance value. Enterococcus results were similar (data not shown).

