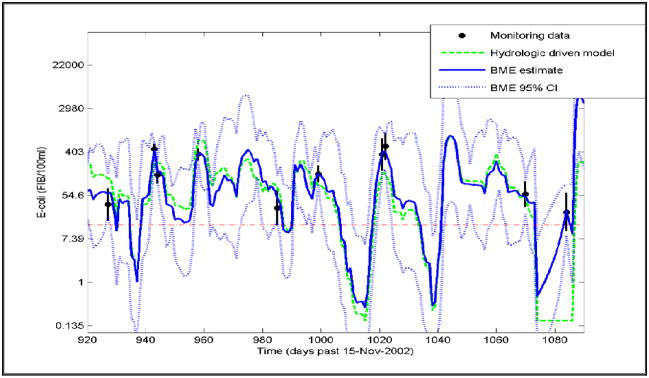
Figure 3.
Temporal plot of the monitoring data (dot centered at the MPN with error bars extending from the lower and upper bounds of the measurement error 95% CI), the hydrologic driven model (dashed line), the BME estimate (plain line) and the BME 95% CI (dotted lines) for E. coli (EC) at site 5A (the western-most sampling site shown in Fig. 1)

