Abstract
The measurement sensitivities of absorbing and fluorescing objects in tissue are compared to determine conditions for which fluorescence data are favorable over those derived from absorption. A simulated human breast volume was used to model the relative perturbation in boundary data caused by a deeply embedded anomaly containing elevated concentrations of theoretical exogenous contrast agents with absorption properties resembling lutetium texaphyrin (LuTex) and Indocyanine Green (ICG). Synthetic data were used to produce quantum yield values representing the transition between conditions favorable to fluorescence versus absorption imaging. The parameters explored include tumor-to-background contrast, background drug concentration, and excitation light filtering efficiency. Drug concentration in the background was the primary factor that determined which contrast mechanism provided the more sensitive measurements. Specifically, fluorescence measurements are favorable if background drug concentrations are below 135–200nM for LuTex and 25–50nM for ICG, while absorption measurements are more sensitive above these ranges.
1. Introduction
Imaging exogenous optical contrast with diffuse optical tomography (DOT) to detect and characterize abnormalities for cancer management has been a goal of considerable interest for more than a decade. While initial efforts focused on imaging contrast derived from optical absorbers, much of the recent activity has shifted to imaging the fluorescence of exogenous agents using luminescent signals. Tomographic imaging of tumor models in small animals using fluorescent probes is a fairly mature technique [1–8]; however, only modest progress has been made toward routine fluorescence imaging in humans, despite numerous efforts focused on imaging the human breast [9–12]. Fluorescence imaging, whether in small animal or human tissue volumes, is a fundamentally challenging problem due to the highly scattered photon field in tissue. An additional challenge associated with human imaging arises from the translation of targeted optical agents that are available preclinically into human studies because of the unproven chemical safety profiles of many fluorescent compounds. To date, Indocyanine Green (ICG) remains the most widely available fluorophore approved for human use. Though ICG is a nonspecific agent, Gurfinkel et al. demonstrated that it provides tumor-to-normal tissue contrast if imaged as a blood pooling agent [13]. ICG also absorbs strongly in the near infrared (NIR) and has been studied for years as a dynamic contrast agent for diffuse optical imaging and spectroscopy in small animals [14–16] as well as in the human breast [17–19]. More recently, molecular reporters have been developed that fluoresce in the NIR range and are used routinely in preclinical studies of tumor models [20–23]. Preliminary clinical trials have been announced suggesting that the potential for optical diagnostic measurement in cancer management will continue to attract a significant amount of attention.
Imaging exogenous contrast based on drug absorption is a common clinical procedure routinely executed with conventional modalities. Radiographic contrast agents, for example, are composed of high-Z-number materials that absorb x rays at clinically relevant energies. These drugs are used to enhance x-ray image contrast and consist of either barium sulfate, used for digestive track imaging, or iodine, which is administered intravenously for imaging blood pharmacokinetics. Optical imaging with absorbing agents is analogous to these techniques involving conventional modalities. Fluorescence imaging is an attractive alternative to absorption approaches primarily because the detected signal originates from the exogenous drug, provided adequate filtering and autofluorescence correction are achieved. Additionally, newly developed optical probes may be activated by or sensitive to the local biological environment, providing unique contrast mechanisms not available through absorption imaging.
Fluorescence emission is inextricably linked to the absorption properties of the fluorophore. By definition, any fluorescing agent must possess the capability to absorb photons in order to transition to higher energy states, from which fluorescence photons are emitted through the radiative relaxation process. The technical challenges associated with imaging fluorescence activity in large tissue volumes such as the breast include filtering the fluorescence excitation light from an emission signal often orders of magnitude lower and accounting for the impact of optical property heterogeneity on the fluorescence yield images. Meeting these challenges requires high sensitivity detection, exceptional optical filtering, and images or accurate estimates of the background optical properties within the imaging field. However, these technical requirements may be simplified if the spatial distribution of the drug concentration is the primary imaging objective and the absorption properties of the exogenous agent alone are sufficient to provide adequate optical contrast.
These factors naturally raise the question of which optical mechanism—absorption or fluorescence—provides the best opportunity for exogenous contrast imaging. This question has been addressed in previous reports by Sevick-Muraca et al. [24] and in a comprehensive numerical study described by Li et al. [25], which compared detection limits for fluorescent and absorbing contrast using analytical frequency domain data. The latter study showed that fluorescence measurements are more sensitive to smaller objects than absorption measurements for a quantum yield of η = 0:1, under the assumption of perfect excitation filtering. However, some fluorophores in current use, such as lutetium texaphyrin (LuTex, η = 0:0019) or protoporphyrin IX (η = 0:005), have much lower quantum yields. Further, the full effects of the quantum yield, background concentration of the fluorophore, and excitation light filtering efficiency have not been explored. Determining the most favorable imaging approach clearly depends on the drug’s quantum yield, among other parameters, and theoretical values of quantum yield exist for which measurements using absorption and fluorescence are equally sensitive.
This study extends prior investigations [20,21] by determining the range of conditions under which fluorescence measurements offer more sensitivity than measurements based on absorption in a realistic breast imaging geometry. Simulated data were used to produce quantum yield values representing the transition between conditions favorable to fluorescence versus absorption imaging for a simulated drug with optical absorption characteristics similar to LuTex. The parameters explored include tumor-to-background contrast, background drug concentration, and excitation light filtering efficiency. Additionally, sensitivity measurements for a simulated drug with optical absorption characteristics similar to ICG were calculated and compared to the analogous measurements determined for a LuTex-like fluorophore.
2. Methods
Numerical experiments were used to investigate the theoretical limits of fluorescence and absorption sensitivity in a simulated human breast. The mathematical model is based on the diffusion approximation, which describes photon propagation through tissue in the NIR. The coupled system of equations describing both transmission and fluorescence photon propagation has been developed throughout the literature [26–30] and is shown here for the continuous wave case to match our experimental configuration:
| (1) |
| (2) |
where subscripts x and m signify the excitation and emission wavelengths λx and λm, respectively, and fl indicates fluorescence emission at λm. Optical parameters µax,m and µsx,m′ are the absorption and reduced scattering coefficients, respectively, q0(r) is an isotropic source, and Φx,fl(r) is the photon fluence rate at position r. The diffusion coefficient is defined as
| (3) |
The fluorescence yield is given by ηµaf (r), a product of the fluorophore’s quantum efficiency, η, and its absorption coefficient, μaf (r) at the excitation wavelength. Importantly, the introduction of a NIR fluorophore also alters the optical absorption µax,m at both excitation and emission wavelengths. The extent of this change is determined by the extinction spectra of the fluorophore and the drug concentration and must be taken into account in the model. The finite element method (FEM) is used to solve these equations in irregular tissue domains, and a detailed description of the FEM implementation was reported previously [31,32].
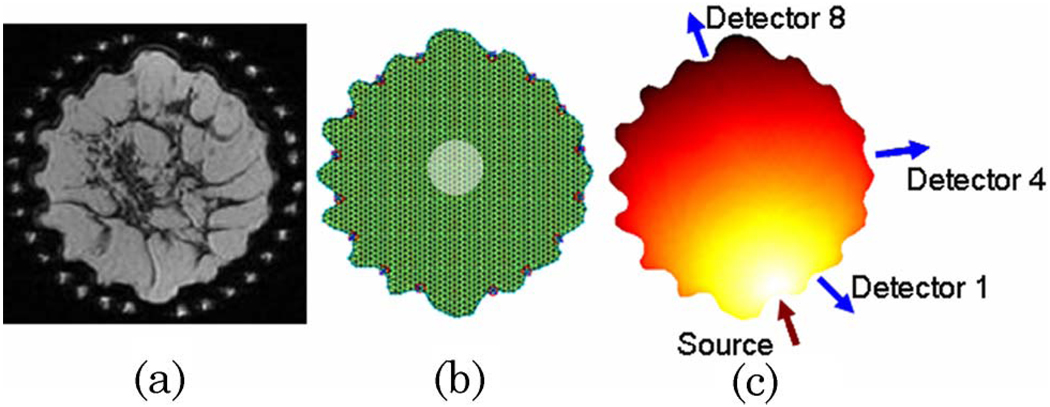
The imaging test field used in this study was composed of a breast-shaped mesh generated from a two-dimensional T1-weighted coronal magnetic resonance image of a human breast surrounded by 16 optical fibers, shown in Fig. 1(a). This configuration was chosen to match our experimental geometry. The irregular boundaries were caused by the optical fibers slightly compressing the breast at their contact points. The maximum diameter of the breast in this slice is 10:9 cm. The image was segmented and discretized into a FEM mesh composed of 1972 nodes and a simulated tumor region 2 cm in diameter was added near the center of the domain [Fig. 1(b)]. It was assumed that this abnormality presented optical contrast in drug concentration only and did not influence the endogenous optical properties. This assumption is a simplification of the physiology of tumor regions in vivo as malignancies are known to impact the optical properties dramatically.
Fig. 1.
(Color online) A T1-weighted coronal magnetic resonance image of the breast (a) was used to generate the simulated domain. The FEM mesh is shown in (b) with the centrally located tumor region in transparent white. The source–detector configuration used throughout the study is provided in (c).
Endogenous optical properties were assigned based on values of chromophore concentrations and scattering parameters typical of the human breast. The domain was considered to be homogeneous in terms of endogenous optical properties, specifically µax = 0:00556mm−1, µam = 0:00617mm−1, µsx′ = 1:45mm−1, and µsm′ = 1:31mm−1. The exogenous absorption and fluorescence contrast were introduced as a simulated drug with the extinction spectra either of LuTex or ICG. LuTex has a strong NIR absorption peak at 735nm and fluorescence emission peak at 750 nm, while ICG excitation and emission peaks are approximately 800 and 830 nm. Quantum yield was varied as an independent variable in the fluorescence emission measurements.
The ability to detect and subsequently image an anomalous region depends on how the diseased tissue perturbs the photon field at detectors located on the tissue surface. The measure of sensitivity used in this study was the relative perturbation in boundary data intensity caused by a drug-enhanced tumor, defined as
| (4) |
where I is the intensity measured at the boundary for a given source–detector pair. Determining P involves solving model Eq. (1) and Eq. (2) with and without the exogenous anomaly (denoted as anom and background, respectively), extracting the appropriate boundary data I, and using Eq. (4). In this work, data for perturbations caused only by exogenous absorption, i.e., measurements not involving fluorescence emission, are termed “transmission” measurements. It should be noted that for transmission measurements, the absolute value of P was used as the perturbation since the anomaly reduces the value of the measured intensity. For fluorescence measurements, P was calculated according to Eq. (4) and negative values were ignored. Throughout this work, transmission measurements were computed at the excitation wavelength of the fluorescence measurements and not the NIR absorption peak. Fluorescence measurements for LuTex were generated for excitation and emission wavelengths of 690 and 761 nm, respectively, and a percentage of the excitation signal was added to the fluorescence data to simulate excitation filtering with optical densities (OD) of 3, 5, and 7 and in some cases, 100. An emission wavelength of 761nm was chosen rather than 750nm since our experimental system is able to measure optical properties at this wavelength routinely, given the availability of laser diodes at this wavelength. The excitation and emission wavelength combination used for the ICG component of this study was 785 and 830 nm, respectively. Perturbation values were calculated for a single source position and one or more detector locations as shown in Fig. 1(c), for both transmission and fluorescence measurements. No additional noise was added to the simulated data beyond that derived from imperfect excitation filtering. The influence of a variety of experimental parameters was investigated using this sensitivity metric, including quantum yield and filtering efficiency, overall drug concentration, and target-to-background contrast.
3. Results
A. Perturbations as a Function of Quantum Yield: LuTex-like Fluorophore
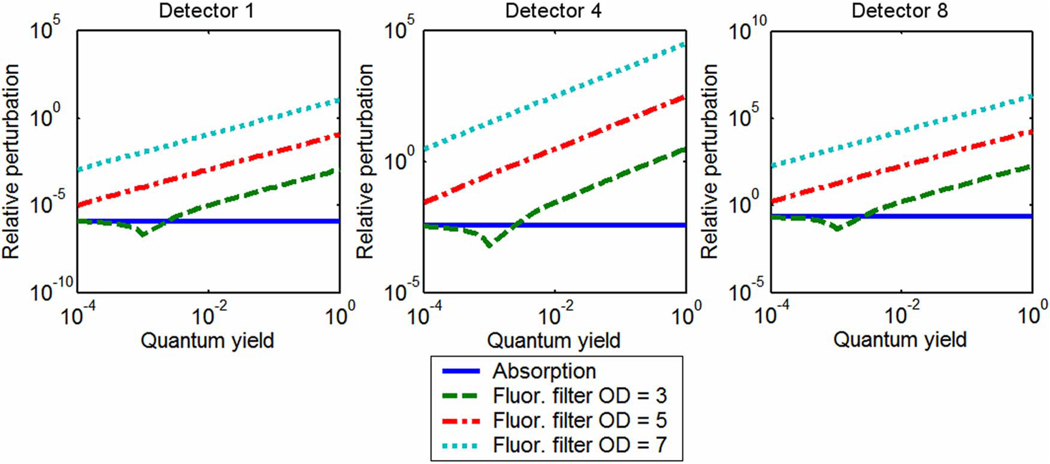
The first set of simulation experiments considered transmission and fluorescence perturbations caused by a centrally located tumor region in two different tumor-to-normal tissue drug uptake situations of a drug resembling LuTex: one an idealized case with infinite contrast and the other a more realistic drug case with finite concentration and a tumor contrast of 3.3:1. Figure 2 presents graphs of relative intensity perturbation as a function of fluorescence quantum yield at three detector positions for infinite exogenous agent contrast. The graphs include perturbations of transmission intensity resulting only from an increase in the concentration of the exogenous agent, as well as fluorescence emission intensity degraded by different amounts of excitation bleed-through. The perturbation caused by absorption is unaffected by quantum yield, as expected, while perturbations in fluorescence signals are proportional to quantum yield. This dependence is due solely to the contamination arising from imperfect filtering of the excitation source. The seemingly anomalous dip in perturbation for the fluorescence case with an excitation filter OD = 3 is easily explained. First, it should be noted that for plotting purposes, the perturbation was calculated as an absolute value and all perturbation values to the left of the minimum are actually negative. It is apparent from Eq. (4) that negative perturbation values indicate that there is a stronger fluorescence signal when there is no fluorophore in the tissue than if the tissue contains a fluorescent anomaly. This is due to the combination of low quantum yield and low filter efficiency. When there is no fluorescent anomaly present in the field, excitation bleed-through accounts for the entire fluorescence signal. The presence of the fluorescent inclusion introduces absorption to the tissue along with the fluorescence activity, reducing the transmitted excitation signal slightly, and therefore reducing the bleed-through signal. If the fluorescence emission is not strong enough to make up for this loss in bleed-through intensity, the perturbation will be negative. In short, more excitation cross-talk signal is lost than light is gained by fluorescence emission in this bleed-through-dominated regime. Although the effect can be eliminated with better filtering, it should be considered when using low-quantum-yield fluorophores.
Fig. 2.
(Color online) Perturbations in transmission amplitude and fluorescence amplitude, given different filtering efficiencies and quantum yield values, caused by a centrally located object with perfect drug uptake. Given these conditions, fluorescence signals are more sensitive to the presence of the object.
It is clear from Fig. 2 that the fluorescence signal is more sensitive to the presence of an anomaly if the tissue contains infinite tumor-to-background contrast of the exogenous agent. This is consistent for all source–detector pairs and filtering efficiencies of OD = 5 and higher, given quantum yields of 0.0001 and above. If the filtering efficiency drops to an experimentally poor three OD, a quantum yield of around 0.001 is required for the fluorescence sensitivity to match that achieved with absorption transmission perturbations, although this depends on which source–detector pair is considered. This intersection defines a quantum yield threshold for given imaging conditions. Thus, contrast agents with quantum yield values higher than this threshold favor fluorescence measurements, while transmission perturbations are greater for those with lower quantum yields. This finding applies to tissue volumes with infinite tumor-to-background contrast.
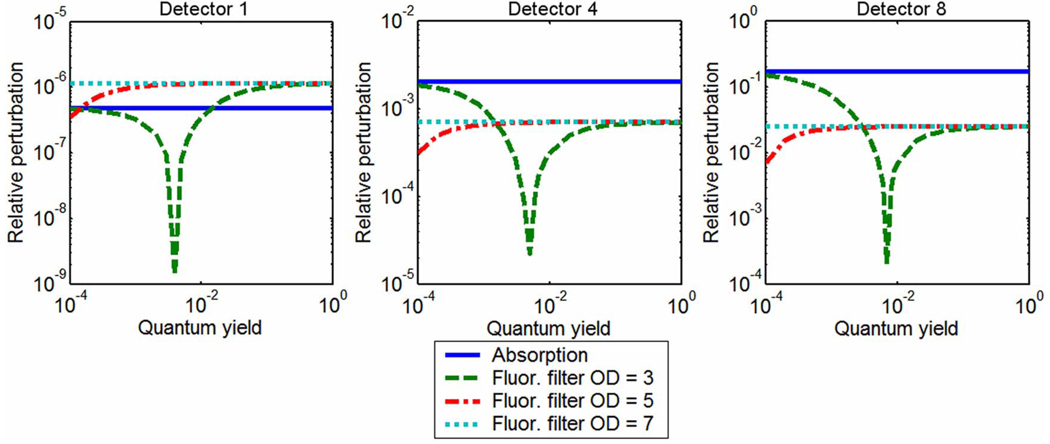
Figure 3 provides results for the case with drug up-take of just over 3.3:1 and a background drug concentration of 300nM. In this case, the absorption perturbations at two of the three detector positions are more significant for all values of quantum yield and filtering efficiencies tested. Sensitivity at the nearest-source detector still favors fluorescence measurements for most values of quantum yield and OD filtering of 5 and above; however, these perturbations are significantly smaller than those detected at the other sensor positions, due to the limited tissue sampling of the quasi-remission geometry. The characteristic dip indicating negative perturbations due to dominance of the bleed-through signal is observed for lower filtering efficiencies. Furthermore, if enough filtering is applied, changes in quantum yield have little influence on the fluorescence perturbations. For detectors #4 and #8, the maximum expected perturbation for fluorescent anomalies is significantly lower than perturbations caused by the absorption profile of the exogenous drug. These results clearly indicate that background concentration and tumor-to-background contrast determine which signal provides the most sensitive measurement, a finding consistent with data provided in Li et al. [25]. This is addressed directly in the next section.
Fig. 3.
(Color online) Perturbations in transmission amplitude and fluorescence amplitude, given different filtering efficiencies and quantum yield values, caused by a centrally located object with imperfect drug uptake. For this imperfect drug uptake case, absorption measurements may be more sensitive to the object than fluorescence emission measurements, depending on source–detector position. This is true regardless of fluorescence quantum yield.
B. Quantum Yield Threshold: LuTex-like Fluorophore
In this component of the study, the quantum yield value at which fluorescence and transmission perturbations intersect, i.e., the quantum yield threshold, was determined for drug contrasts ranging from 1.1:1 to 11:1 and background concentrations ranging from 10 to 1000 nM. The secant root finding method, initialized with the output of a bisection algorithm, was used to determine the quantum yield value that minimized the difference between fluorescence and transmission perturbations over the range η = 10−6 to η = 1 for each combination of contrast and background concentration. The exogenous contrast distribution was assumed to be homogeneous except for the tumor region.
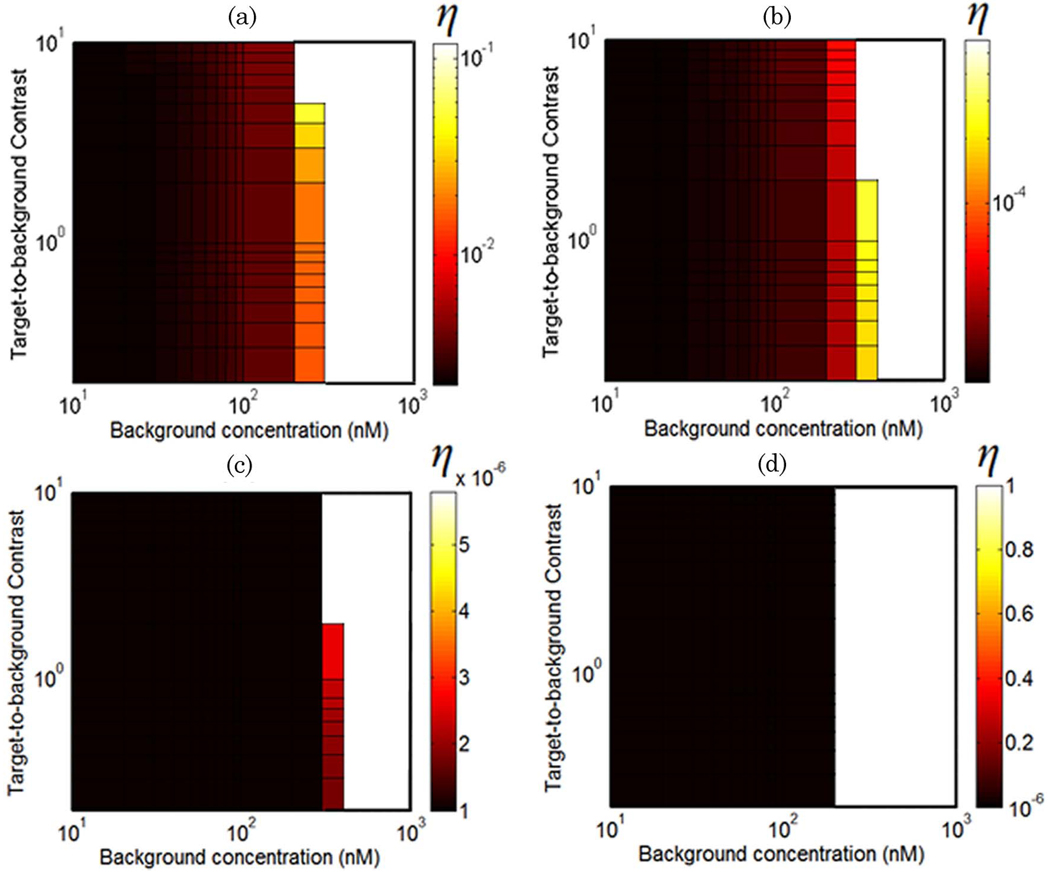
The values of quantum yield at which fluorescence and transmission perturbations are equal at detector #4 are plotted in Fig. 4 for a range of background drug concentrations and target-to-background contrasts. These values represent the transition between regimes in which absorption measurements are more sensitive than fluorescence measurements, given a drug with a similar absorption profile to LuTex. Figures 4(a)–4(d) provide threshold quantum yield values for excitation filtering efficiencies of OD = 3, 5, 7, and 100, respectively. The lower limit of the color bars in Figs. 4(c) and 4(d) is 10−6 due to the limited range of quantum yield values considered in this study, η = 10−6 to η = 1. While the results indicate that fluorescence perturbations are larger than absorption perturbations in this regime as long as the quantum yield is greater than 10−6, the actual quantum yield threshold values are lower than this artificially introduced limit. The white regions de-note regimes for which absorption perturbations are always larger than fluorescence perturbations, regardless of quantum yield value. The leftmost edge of this region, at approximately 200nM, represents a hard upper limit for background drug concentrations above which transmission perturbations are always more sensitive. This limit is only modestly sensitive to the object contrast for the data sampling evaluated here.
Fig. 4.
(Color online) Surface plots of threshold quantum yield values for excitation filtering efficiencies of OD = 3, 5, 7, and 100 [(a)–(d), respectively] over a range of contrasts and background concentrations. These curves are plotted for the detector oriented 90° to the source (detector #4). The color bar values represent the quantum yield value for which absorption and fluorescence measurements are equally sensitive to a centrally located tumor region. White regions indicate conditions for which absorption measurements are always more sensitive, regardless of quantum yield.
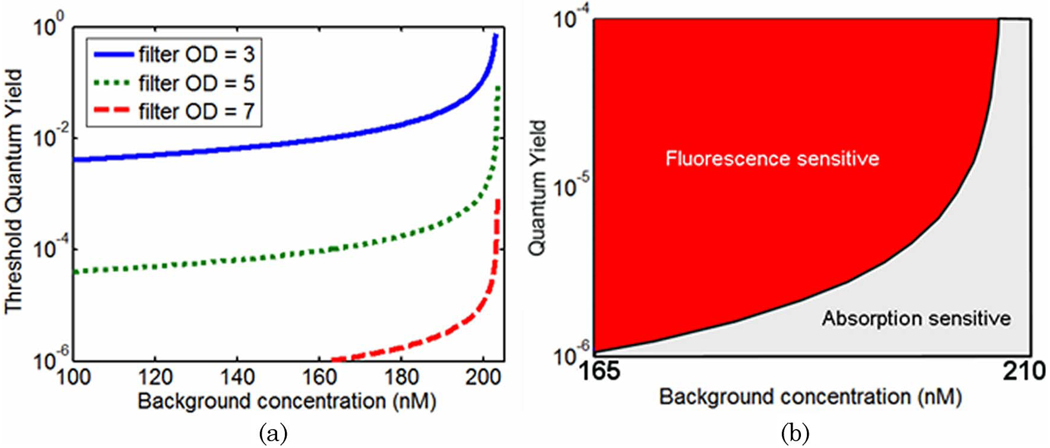
To visualize the influence of background drug concentration on the threshold quantum yield values, cross-sectional plots along a single contrast value (6:1 in this case) are presented in Fig. 5. Since data sampling near the absorption–fluorescence equality boundary was rather sparse for the results presented in Fig. 4, the data were resampled to produce the curves shown in Fig. 5. These curves represent the minimum value of quantum yield required to ensure that fluorescence measurements are more sensitive to the tumor region than transmission measurements for a range of excitation filtering efficiencies. Thus, the two regimes may be defined based on contrast agent quantum yield and expected background concentration. Regions above and to the left of a given curve represent a “fluorescence sensitive” regime while background/quantum yield combinations below and to the right of each curve can be considered “absorption sensitive”, assuming a 6:1 target-to-background contrast. This is illustrated in Fig. 5(b) for the OD = 7 filter results. The more highly sampled data better illustrates the asymptotic behavior near the transition between preferential fluorescence versus absorption sensitivity. Conditions clearly favor transmission measurements when background drug concentration exceeds 200nM, regardless of filtering efficiency. On the lower concentration side of this boundary, excitation filtering efficiency has a large impact on threshold quantum yield values. As filtering efficiency degrades, higher and higher quantum yields are required to produce meaningful fluorescence perturbations at the tissue surface.
Fig. 5.
(Color online) (a) Threshold quantum yield values for detector #4 plotted as a function of background drug concentration for a 6:1 tumor-to-background contrast. (b) The quantum yield threshold curves delineate experimental conditions that favor fluorescence and absorption measurements.
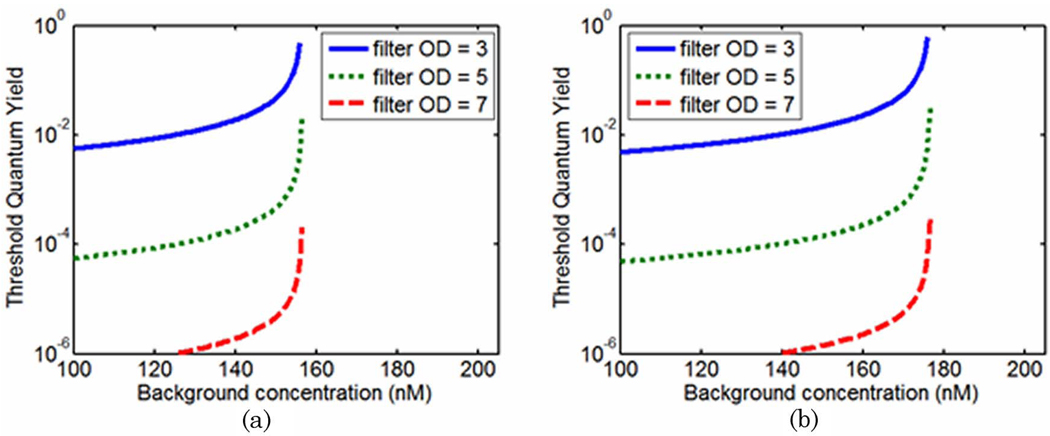
Other factors that may influence these results include source–detector positions and optical properties at the wavelengths of interest. Similar curves to those shown in Fig. 5 were generated for the far-from-source detector (detector #8 in Fig. 1) and are shown in Fig. 6(a). In this configuration, transmission measurements are favorable at lower drug concentrations than when the source and detector positions are 90° to each other. The transition between the two regimes exists at 157nM.
Fig. 6.
(Color online) Threshold quantum yield values plotted as a function of background drug concentration for a 6:1 tumor-to-background contrast. (a) Curves are plotted for the detector opposite the source (detector #8). (b) The optical properties at the excitation and emission wavelengths were assumed to be identical and data presented are for detector #4.
The perturbations in Fig. 6(b) were calculated under the assumption that optical properties at excitation and emission wavelengths were equal (data at detector #4 is shown). This is identical to assuming that the fluorescence measurements are made at the excitation wavelength. Although this is not feasible in practice, it can easily be considered numerically and serves to eliminate any influence that differences in optical properties between λx and λm might have on the calculated perturbations. The result of this experiment shows similar curves to those presented in Fig. 5 and Fig.6(a), indicating that the transition between regimes in which fluorescence and absorption measurements are more sensitive is not solely a manifestation of the different optical properties encountered by the photon fields at the excitation and emission wavelengths.
C. Intersection of Fluorescence and Transmission Perturbations: LuTex-like Fluorophore
To further investigate the transition between fluorescence and absorption sensitivity, the relative perturbations of fluorescence and transmission measurements were calculated over a range of background drug concentrations. The drug was assumed to have perfect quantum yield (η = 1), representing the best case scenario for fluorescence measurements. The tumor-to-background contrast was held constant at 6:1 as the overall concentration of the drug ranged from 1nM to 10 µM. The optical properties at the excitation and emission wavelengths were assumed to be identical. In the data presented below, the filtering efficiency of fluorescence measurements was assumed to be either nearly perfect (OD = 100) or fairly poor (OD = 3).
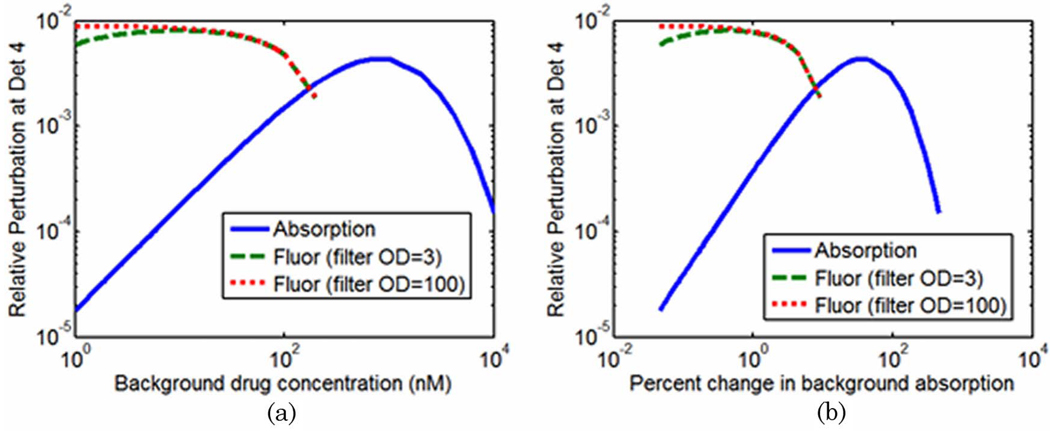
The relative perturbations in boundary data at detector #4, as defined by Eq. (4), are plotted as a function of drug concentration in Fig. 7(a), which clearly shows the intersection of the fluorescence and absorption measurements in the 100–200 nM range. The relative perturbations of fluorescence and transmission measurements follow dramatically different paths as drug concentration is varied. In Fig. 7(b) the same data are plotted as the percent change in the optical properties (in the background) caused by the addition of the drug. For the parameters considered, the intersection of the perturbations takes place when the drug contributes approximately 8% of the overall absorption coefficient.
Fig. 7.
(Color online) (a) Relative perturbations of boundary data at detector #4 plotted as a function of background drug concentration and (b) percent change in the absorption coefficient of the background.
D. Quantum Yield Threshold: ICG-like Fluorophores
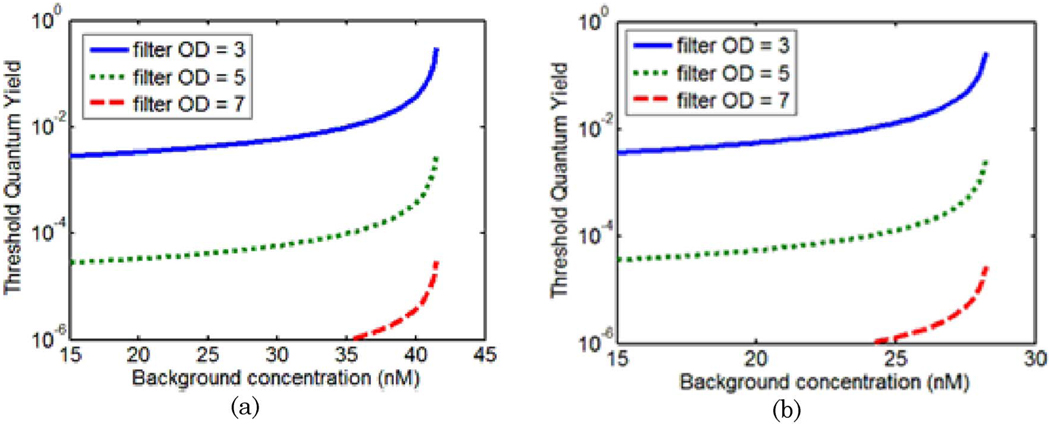
The analysis of a simulated drug with absorption properties similar to that of LuTex was expanded to include a drug with absorption properties similar to ICG. The methodology used in this analysis was identical to that described previously, though the extinction spectrum of the drug was changed to match that of ICG. Threshold quantum yield values for a tumor contrast of 6:1 in drug concentration are plotted in Fig. 8 for detector positions 4 and 8 [(a) and (b), respectively]. These graphs may be compared directly to those for the LuTex-like drug presented in Fig. 5(a) and Fig.6(a). While these graphs have similar features, the transitions between fluorescence-and absorption-sensitive measurements under perfect filtering occur at drug concentrations of 42 and 28nM for detectors 4 and 8, respectively. These values are significantly lower than those computed for a LuTex-like fluorophore.
Fig. 8.
(Color online) Threshold quantum yield values plotted as a function of background drug concentration for a 6:1 tumor-to-background contrast. In this case, a simulated drug with absorption properties resembling those of ICG was used as the exogenous agent. Curves are plotted for a detector 90° from the source (detector #4) in (a) and the detector opposite the source (detector #8) in (b).
4. Discussion
The initial results for a tissue volume with infinite tumor contrast substantiate the conventional wisdom that favors fluorescence over absorption imaging; however, many contrast agents, including all optical compounds currently approved for in vivo human use, will not provide infinite specificity. Thus, imperfect uptake must be considered. As shown here, when the contrast agent is present in the background, perturbations in boundary data caused by the fluorescing tumor region are not necessarily larger than those introduced by the absorption properties of the drug. Results for these more realistic cases indicate that background drug concentration is the primary factor that determines whether transmission measurements are more sensitive than fluorescence emission measurements. Changes in background drug concentration alter the relative perturbations in boundary data caused by each mechanism differently. At a specific concentration these curves intersect, representing the transition between the two contrast mechanisms, below which fluorescence provides the more sensitive measurement and above which transmission measurements are more sensitive to the presence of the anomalous region.
Though changes in drug quantum yield have no effect on the relative perturbations in fluorescence measurements provided the excitation light is completely eliminated from the fluorescence signal, imperfect filtering makes quantum yield an important factor in determining the fluorescence perturbation in practice. Below the concentration that represents the fluorescence-absorption hard limit, the trade-off between filtering efficiency and quantum yield has a major impact on which measurement is more sensitive. In this regime, it is possible to determine the quantum yield values that ensure fluorescence perturbations are equal to perturbations arising from the corresponding contrast in absorption for a given filtering efficiency. These values can be used to produce a threshold quantum yield curve, or surface, which defines whether fluorescence or absorption measurements are more sensitive for a given excitation filtering efficiency.
Regardless of filtering efficiency, all quantum yield threshold curves asymptote at the fluorescence-absorption hard limit at a certain background drug concentration. Significantly, the limits determined in this study ranged from 28 to 200 nM; depending on the drug used, the tissue optical properties, and source–detector geometry—a range that is clinically relevant for imaging blood pooling agents in vivo. Limits for the drug resembling ICG were 28 and 42nM for detectors eight and 4, respectively, and were significantly lower than those computed for Lutex, 160 and 200 nM. The stronger absorption characteristics of ICG are responsible for this difference, resulting in a wider range of drug concentrations favoring absorption imaging. In general, these transition limits occurred when the background drug concentration changed the overall absorption in the tissue by 6–13%, depending on the drug used and source–detector arrangement.
On the low concentration side of the transition boundary, proper filtering is the major factor influencing the quantum yield threshold curves. In this regime, conditions favor fluorescence if the quantum yield is approximately an order of magnitude lower than the inverse of the filter OD for the 6:1 contrast case considered here. For example, threshold quantum yield values are approximately 10−2 for 3 OD filtering. If these general trends apply consistently to different fluorophores, they may provide a simple rule of thumb, as long as an estimate of expected contrast is in hand.
Since these simulation studies considered only the idealized detection case, no evaluation of detector signal-to-noise ratio was included beyond excitation contamination of the fluorescence signal. However, if the noise behavior of both detection channels is similar, the results presented here will be unchanged provided measurements occur above the noise floor of the detection system. Analysis of detection thresholds between transmission and fluorescence measurements has been studied extensively by Li et al. [25].
Other factors that will most certainly impact the results of this study include the presence of auto-fluorescence in the imaged volume, absorption spectrum of the drug, size and location of the anomaly, and imaging wavelengths used. Nonspecific auto-fluorescence signals can be overwhelming, even in the NIR, especially when using targeted probes, which are often allowed to clear from normal tissue over the course of several days. Autofluorescence correction is critical in cases where the drug concentration or quantum yield is relatively low.
The choice of excitation and emission wavelengths is often dictated by experimental conditions and clearly impacts the relative perturbation measurements. The fluorescence excitation wavelength applied experimentally is often shorter than the absorption peak of the drug, sacrificing optical absorption cross section for reduced excitation contamination in the emission signal. LuTex, for example, has a relatively small Stokes shift and in order to achieve effective filtering, an excitation wavelength of 690nm was selected instead of the 735nm absorption peak. In practice, transmission data perturbations will likely be measured at the absorption peak of the drug rather than at the excitation wavelength to maximize the photon absorption due to the drug, further reducing the value of the drug concentration transition between fluorescence and absorption sensitivities. This effectively increases the range of conditions for which absorption measurements are favorable.
Only positive values of the fluorescence perturbation are shown in Fig. 4 through Fig.8. At higher drug concentrations, the fluorescence signal at the detector was found to be higher for the homogeneous domain than for the domain containing the anomalous region with elevated fluorophore. Under these conditions, the elevated absorption overcomes the increase in fluorescence activity in the anomaly. Although this creates a situation where the absolute value of the fluorescence perturbation may exceed that of the transmission measurements, fluorescence tomography algorithms will be unable to recover elevated fluorescent objects unless the optical properties are known precisely, which in turn is contingent upon the sensitivity of the transmission measurements. As a result, negative fluorescence perturbations were ignored for the purposes of this study.
An important issue not addressed in this study involves distinguishing the absorption arising from the exogenous agent from endogenous absorption. This is not a problem for dynamic imaging, where changes in tissue absorption are measured; however, in the single-wavelength approach discussed here, static quantification of in vivo optical absorption offers no information on whether the source of the absorption is endogenous or exogenous. This leads to one of the undeniable advantages of fluorescence imaging: the measured signal is often produced entirely by the administered agent, provided appropriate excitation filtering and autofluorescence corrections are in place. However, multispectral approaches that use endogenous and exogenous extinction spectra as prior information may be able to recover chromophore concentrations directly [33–37].
The results of this study have broad implications for a variety of imaging approaches. In vivo drug concentrations of targeted contrast agents and molecular probes such as receptor targeted compounds, which incubate for several hours or even days, are expected to be fairly low given the long clearance times allowed. In these cases, fluorescence imaging is likely the most sensitive approach. On the other hand, imaging drug pharmacokinetics, for example, with ICG [12,15,17–19], is often performed within minutes of the delivery of large systemic doses, resulting in relatively high background concentrations. In these cases, it is less clear whether fluorescence emission would be the most effective imaging approach, provided drug concentration, and not fluorescence activity, is the parameter of interest. For the LuTex and ICG probes simulated in this study, background concentrations above 100–200nM and 25–50 nM, respectively, would favor absorption imaging, regardless of expected contrasts. Simulation studies similar to those presented here can be repeated for any contrast agent and imaging geometry, enabling amore informed approach for selecting in vivo imaging parameters.
5. Conclusion
The sensitivity of fluorescence and transmission measurements was compared in the context of imaging exogenous optical contrast agents in the human breast. The results delineate the fluorescence- and absorption-sensitive regimes based on drug concentration in the background, excitation filtering efficiency, and fluorophore quantum yield. Drug concentration was found to be the most important factor in determining which measurement is more sensitive. For a given drug and measurement geometry, a specific drug concentration can be determined for which fluorescence and transmission perturbations are equal. Below this intersection, fluorescence emission provides the most sensitive measurements, provided adequate excitation filtering is in place. Above this intersection, changes in boundary data caused by absorbing anomalies exceed those generated by fluorescing anomalies, regardless of the filtering efficiency and fluorescence quantum yield of the drug. This behavior may readily be determined for any contrast agent and imaging geometry and thus may be used to guide experimental measurement procedures.
Acknowledgments
This work was funded by the National Institutes of Health (NIH) grants RO1 CA109558, RO1 CA69544, and U54 CA105480 as well as Department of Defense Breast Cancer predoctoral fellowship BC051058.
References
- 1.Ntziachristos V, Tung CH, Bremer C, Weissleder R. Fluorescence molecular tomography resolves protease activity in vivo. Nat. Med. 2002;8:757–760. doi: 10.1038/nm729. [DOI] [PubMed] [Google Scholar]
- 2.Graves E, Ripoll J, Weissleder R, Ntziachristos V. A submillimeter resolution fluorescence molecular imaging system for small animal imaging. Med. Phys. 2003;30:901–911. doi: 10.1118/1.1568977. [DOI] [PubMed] [Google Scholar]
- 3.Ntziachristos V, Schellenberger EA, Ripoll J, Yessayan D, Graves E, Bogdanov A, Jr, Josephson L, Weissleder R. Visualization of antitumor treatment by means of fluorescence molecular tomography with an annexin V-Cy5.5 conjugate. Proc. Natl. Acad. Sci. U.S.A. 2004;101:12294–12299. doi: 10.1073/pnas.0401137101. [DOI] [PMC free article] [PubMed] [Google Scholar]
- 4.Graves EE, Weissleder R, Ntziachristos V. Fluorescence molecular imaging of small animal tumor models. Curr. Mol. Med. 2004;4:419–430. doi: 10.2174/1566524043360555. [DOI] [PubMed] [Google Scholar]
- 5.Schulz RB, Ripoll J, Ntziachristos V. Experimental fluorescence tomography of tissues with noncontact measurements. IEEE Trans. Med. Imaging. 2004;23:492–500. doi: 10.1109/TMI.2004.825633. [DOI] [PubMed] [Google Scholar]
- 6.Zacharakis G, Ripoll J, Weissleder R, Ntziachristos V. Fluorescent protein tomography scanner for small animal imaging. IEEE Trans. Med. Imaging. 2005;24:878–885. doi: 10.1109/tmi.2004.843254. [DOI] [PubMed] [Google Scholar]
- 7.Patwardhan SV, Bloch SR, Achilefu S, Culver JP. Time-dependent whole-body fluorescence tomography of probe bio-distributions in mice. Opt. Express. 2005;13:2564–2577. doi: 10.1364/opex.13.002564. [DOI] [PubMed] [Google Scholar]
- 8.Graves EE, Yessayan D, Turner G, Weissleder R, Ntziachristos V. Validation of in vivo fluorochrome concentrations measured using fluorescence molecular tomography. J. Biomed. Opt. 2005;10:044019. doi: 10.1117/1.1993427. [DOI] [PubMed] [Google Scholar]
- 9.Godavarty A, Eppstein MJ, Zhang C, Sevick-Muraca EM. Detection of single and multiple targets in tissue phantoms with fluorescence-enhanced optical imaging: feasibility study. Radiology (Oak Brook, Ill.) 2005;235:148–154. doi: 10.1148/radiol.2343031725. [DOI] [PubMed] [Google Scholar]
- 10.Godavarty A, Thompson AB, Roy R, Gurfinkel M, Eppstein MJ, Zhang C, Sevick-Muraca EM. Diagnostic imaging of breast cancer using fluorescence-enhanced optical tomography: phantom studies. J. Biomed. Opt. 2004;9:488–496. doi: 10.1117/1.1691027. [DOI] [PubMed] [Google Scholar]
- 11.Godavarty A, Zhang C, Eppstein MJ, Sevick-Muraca EM. Fluorescence-enhanced optical imaging of large phantoms using single and simultaneous dual point illumination geometries. Med. Phys. 2004;31:183–190. doi: 10.1118/1.1639321. [DOI] [PubMed] [Google Scholar]
- 12.Corlu A, Choe R, Durduran T, Rosen MA, Schweiger M, Arridge SR, Schnall MD, Yodh AG. Three-dimensional in vivo fluorescence diffuse optical tomography of breast cancer in humans. Opt. Express. 2007;15:6696–6716. doi: 10.1364/oe.15.006696. [DOI] [PubMed] [Google Scholar]
- 13.Gurfinkel M, Thompson AB, Ralston W, Troy TL, Moore AL, Moore TA, Gust JD, Tatman D, Reynolds JS, Muggenburg B, Nikula K, Pandey R, Mayer RH, Hawrysz DJ, Sevick-Muraca EM. Pharmacokinetics of ICG and HPPH-car for the detection of normal and tumor tissue using fluorescence, near-infrared reflectance imaging: a case study. Photochem. Photobiol. 2000;72:94–102. doi: 10.1562/0031-8655(2000)072<0094:poiahc>2.0.co;2. [DOI] [PubMed] [Google Scholar]
- 14.Cuccia DJ, Bevilacqua F, Durkin AJ, Merritt S, Tromberg BJ, Gulsenv G, Yu H, Wang J, Nalcioglu O. In vivo quantification of optical contrast agent dynamics in rat tumors by use of diffuse optical spectroscopy with magnetic resonance imaging coregistration. Appl. Opt. 2003;42:2940–2950. doi: 10.1364/ao.42.002940. [DOI] [PubMed] [Google Scholar]
- 15.Gulsen G, Yu H, Wang J, Nalcioglu O, Merritt S, Bevilacqua F, Durkin AJ, Cuccia DJ, Lanning R, Tromberg BJ. Congruent MRI and near-infrared spectroscopy for functional and structural imaging of tumors. Technol. Cancer Res. Treat. 2002;1:497–505. doi: 10.1177/153303460200100610. [DOI] [PubMed] [Google Scholar]
- 16.Hillman EMC, Moore A. All-optical anatomical co-registration for molecular imaging of small animals using dynamic contrast. Nat. Photonics. 2007;1:526–530. doi: 10.1038/nphoton.2007.146. [DOI] [PMC free article] [PubMed] [Google Scholar]
- 17.Alacam B, Yazici B, Intes X, Nioka S, Chance B. Pharmacokinetic-rate images of indocyanine green for breast tumors using near-infrared optical methods. Phys. Med. Biol. 2008;53:837–859. doi: 10.1088/0031-9155/53/4/002. [DOI] [PubMed] [Google Scholar]
- 18.Intes X, Ripoll J, Chen Y, Nioka S, Yodh AG, Chance B. In vivo continuous-wave optical breast imaging enhanced with Indocyanine Green. Med. Phys. 2003;30:1039–1047. doi: 10.1118/1.1573791. [DOI] [PubMed] [Google Scholar]
- 19.Ntziachristos V, Yodh AG, Schnall M, Chance B. Concurrent MRI and diffuse optical tomography of breast after indocyanine green enhancement. Proc. Natl. Acad. Sci. USA. 2000;97:2767–2772. doi: 10.1073/pnas.040570597. [DOI] [PMC free article] [PubMed] [Google Scholar]
- 20.Bremer C, Ntziachristos V, Weissleder R. Optical-based molecular imaging: contrast agents and potential medical applications. Eur. Radiol. 2003;13:231–243. doi: 10.1007/s00330-002-1610-0. [DOI] [PubMed] [Google Scholar]
- 21.Massoud TF, Gambhir SS. Molecular imaging in living subjects: seeing fundamental biological processes in a new light. Genes Dev. 2003;17:545–580. doi: 10.1101/gad.1047403. [DOI] [PubMed] [Google Scholar]
- 22.Ntziachristos V. Fluorescence molecular imaging. Annu. Rev. Biomed. Imaging. 2006;8:1–33. doi: 10.1146/annurev.bioeng.8.061505.095831. [DOI] [PubMed] [Google Scholar]
- 23.Weissleder R, Mahmood U. Molecular imaging. Radiology (Oak Brook, Ill.) 2001;219:316–336. doi: 10.1148/radiology.219.2.r01ma19316. [DOI] [PubMed] [Google Scholar]
- 24.Sevick-Muraca EM, Lopez G, Reynolds JS, Troy TL, Hutchinson CL. Fluorescence and absorption contrast mechanisms for biomedical optical imaging using frequency-domain techniques. Photochem. Photobiol. 1997;66:55–64. doi: 10.1111/j.1751-1097.1997.tb03138.x. [DOI] [PubMed] [Google Scholar]
- 25.Li X, Chance B, Yodh AG. Fluorescent heterogeneities in turbid media: limits for detection, characterization, and comparison with absorption. Appl. Opt. 1998;37:6833–6844. doi: 10.1364/ao.37.006833. [DOI] [PubMed] [Google Scholar]
- 26.Eppstein MJ, Hawrysz DJ, Godavarty A, Sevick-Muraca EM. Three-dimensional, Bayesian image reconstruction from sparse and noisy data sets: near-infrared fluorescence tomography. Proc. Natl. Acad. Sci. USA. 2002;99:9619–9624. doi: 10.1073/pnas.112217899. [DOI] [PMC free article] [PubMed] [Google Scholar]
- 27.Hawrysz DJ, Sevick-Muraca EM. Developments toward diagnostic breast cancer imaging using near-infrared optical measurements and fluorescent contrast agents. Neoplasia. 2000;2:388–417. doi: 10.1038/sj.neo.7900118. [DOI] [PMC free article] [PubMed] [Google Scholar]
- 28.Jiang HB. Frequency-domain fluorescent diffusion tomography: a finite-element-based algorithm and simulations. Appl. Opt. 1998;37:5337–5343. doi: 10.1364/ao.37.005337. [DOI] [PubMed] [Google Scholar]
- 29.Milstein AB, Seungseok O, Webb KJ, Bouman CA, Zhang Q, Boas DA, Millane RP. Fluorescence optical diffusion tomography. Appl. Opt. 2003;42:3081–3094. doi: 10.1364/ao.42.003081. [DOI] [PubMed] [Google Scholar]
- 30.Paithankar DY, Chen AU, Pogue BW, Patterson MS, Sevick-Muraca EM. Imaging of fluorescent yield and life-time from multiply scattered light reemitted from random media. Appl. Opt. 1997;36:2260–2272. doi: 10.1364/ao.36.002260. [DOI] [PubMed] [Google Scholar]
- 31.Davis SC, Dehghani H, Wang J, Jiang S, Pogue BW, Paulsen KD. Image-guided diffuse optical fluorescence tomography implemented with Laplacian-type regularization. Opt. Express. 2007;15:4066–4082. doi: 10.1364/oe.15.004066. [DOI] [PubMed] [Google Scholar]
- 32.Dehghani H, Eames ME, Yalavarthy PK, Davis SC, Srinivasan S, Carpenter CM, Pogue BW, Paulsen KD. Near infrared optical tomography using NIRFAST: Algorithm for numerical model and image reconstruction. Commun. Numer. Methods Eng. doi: 10.1002/cnm.1162. in press. [DOI] [PMC free article] [PubMed] [Google Scholar]
- 33.Corlu A, Durduran T, Choe R, Schweiger M, Hillman EM, Arridge SR, Yodh AG. Uniqueness and wavelength optimization in continuous-wave multispectral diffuse optical tomography. Opt. Lett. 2003;28:2339–2341. doi: 10.1364/ol.28.002339. [DOI] [PubMed] [Google Scholar]
- 34.Li A, Zhang Q, Culver J, Miller E, Boas D. Reconstructing chromophore concentration images directly by continuous-wave-diffuse optical tomography. Opt.Lett. 2004;29:256–258. doi: 10.1364/ol.29.000256. [DOI] [PubMed] [Google Scholar]
- 35.Srinivasan S, Pogue BW, Brooksby B, Jiang S, Dehghani H, Kogel C, Wells WA, Poplack SP, Paulsen KD. Near-infrared characterization of breast tumors in vivo using spectrally-constrained reconstruction. Technol. Cancer Res. Treat. 2005;4:513–526. doi: 10.1177/153303460500400505. [DOI] [PubMed] [Google Scholar]
- 36.Srinivasan S, Pogue BW, Jiang S, Dehghani H, Kogel C, Soho S, Gibson JJ, Tosteson TD, Poplack SP, Paulsen KD. In vivo hemoglobin and water concentrations, oxygen saturation, and scattering estimates from near-infrared breast tomography using spectral reconstruction. Acad. Radiol. 2006;13:195–202. doi: 10.1016/j.acra.2005.10.002. [DOI] [PubMed] [Google Scholar]
- 37.Davis SC, Pogue BW, Srinivasan S, Dehghani H, Paulsen KD OSA Technical Digest Series (CD) Biomedical Optics. Optical Society of America; 2006. Development of spectrally-constrained diffuse optical tomography for imaging exogenous contrast agents. paper SH36. [Google Scholar]


