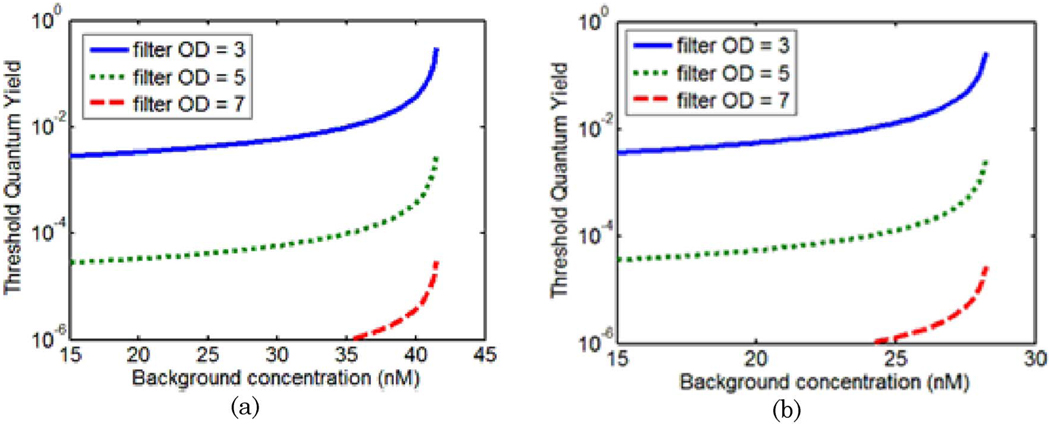
Fig. 8.
(Color online) Threshold quantum yield values plotted as a function of background drug concentration for a 6:1 tumor-to-background contrast. In this case, a simulated drug with absorption properties resembling those of ICG was used as the exogenous agent. Curves are plotted for a detector 90° from the source (detector #4) in (a) and the detector opposite the source (detector #8) in (b).

