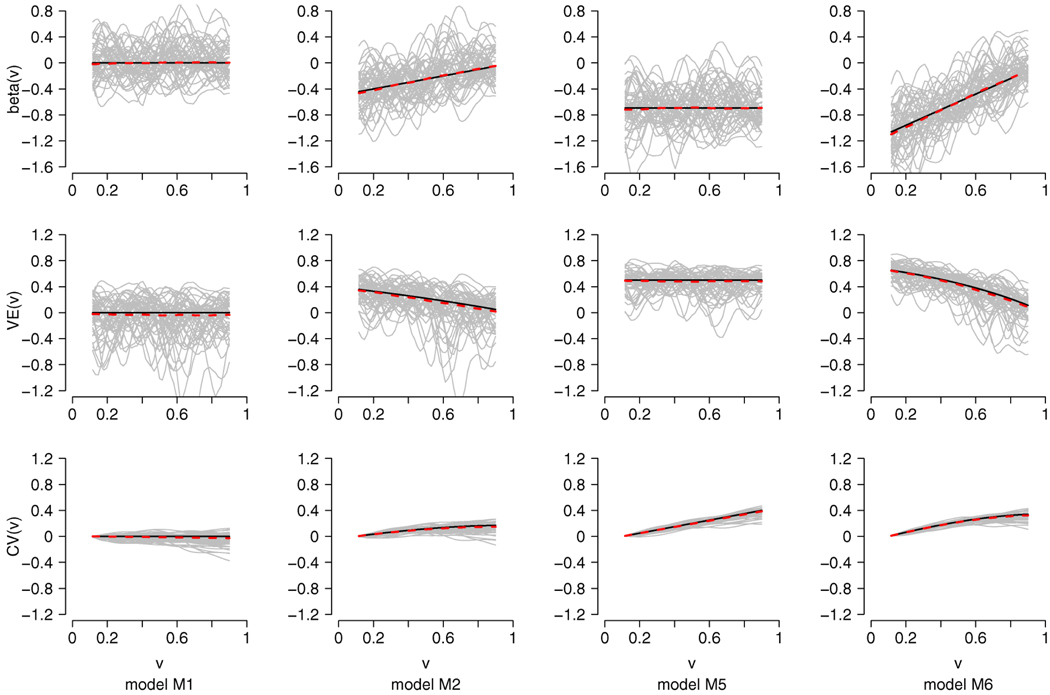
FIG. 1.
Plots of estimates for β(υ), VE(υ) and CV(υ) under the models M1, M2, M5 and M6 for n = 500, h = 0.1. The solid dark lines are the true functions and the dashed lines are the averages of the estimates based on 1000 repetitions. The gray lines are the corresponding estimates for β(υ), VE(υ) and CV(υ) of 50 random samples.

