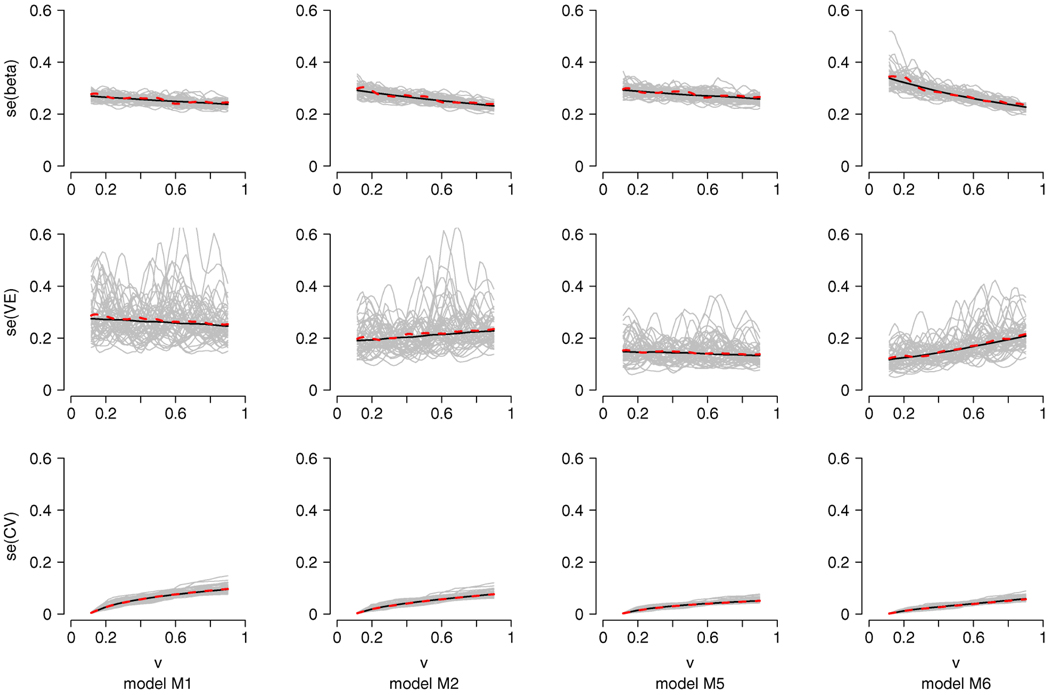
FIG. 2.
Plots of the standard errors under the models M1, M2, M5 and M6, based on n = 500, h = 0.1. The solid lines are the averages of the estimates of the standard deviations of β̂(υ), , while the dashed lines are the sample standard deviations of β̂(υ), , based on 1000 repetitions. The gray lines are the corresponding estimates for the standard deviations of β̂(υ), of 50 random samples.

