
Figure 3.
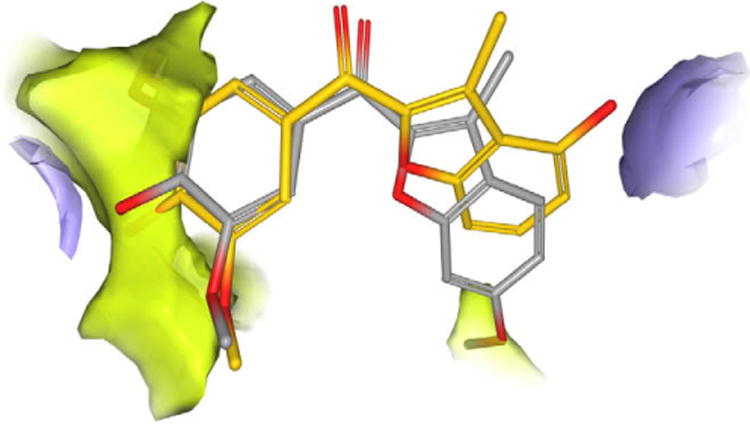
Putative binding mode of compound 4r (colored in gray) and 4v (colored in yellow). Lipophilic potential map represented in green; H-bond donor potential map represented in purple.
Official websites use .gov
A
.gov website belongs to an official
government organization in the United States.
Secure .gov websites use HTTPS
A lock (
) or https:// means you've safely
connected to the .gov website. Share sensitive
information only on official, secure websites.
Putative binding mode of compound 4r (colored in gray) and 4v (colored in yellow). Lipophilic potential map represented in green; H-bond donor potential map represented in purple.