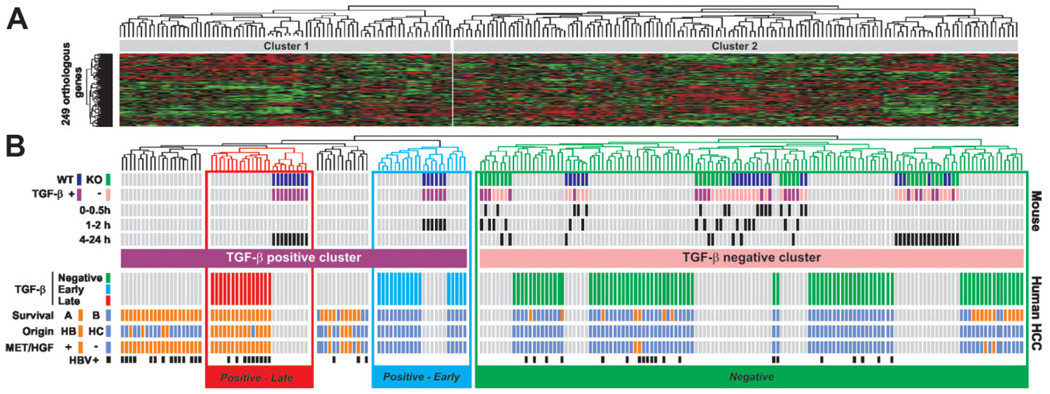
Fig. 2.
Discrete temporal mouse TGF-β gene expression signatures define distinct subtypes of human HCC. (A) Dendrogram and heat-map overview of mouse data set integrated with 139 cases of human HCC. Clustering was based on the expression of 249 orthologous genes and the data are presented in a matrix format in which rows and columns represent genes and samples, respectively. (B) Detailed view of mouse and human samples cluster analysis. Upper part: Clustering of mouse samples corresponding to WTand KO hepatocytes challenged (+) or not (−) with TGF-β for a given time identified at the beginning of each row. Clustering analysis identified a TGF-β-positive cluster corresponding to WT-treated hepatocytes and a TGF-β-negative cluster corresponding to untreated and treated KO hepatocytes as well as untreated WT hepatocytes. Lower part: Clustering of human HCC samples. Integration of mouse and human samples sorted human HCC into TGF-β-positive and TGF-β-negative clusters. Within the TGF-β-positive cluster, the analysis of dendrogram branches revealed two homogeneous subtypes of HCC associated with WT hepatocytes treated for 1 to 2 hours and 4 to 24 hours and annotated Positive-Early and Positive-Late, respectively. Distribution of HCC between previously described subgroups with respect to survival (A, bad prognosis versus B, good prognosis), cell origin (HB, hepatoblast versus HC, hepatocyte), c-Met/hepatocyte growth factor (HGF) signature (− versus +) or HBV infection status is indicated at the beginning of each row.

