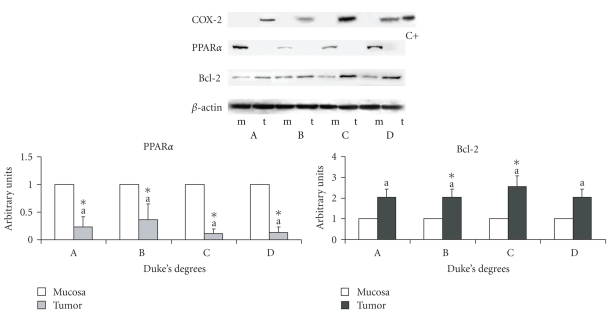
Figure 1.
Protein content of COX-2, PPARα, and Bcl-2 in cancer specimens and corresponding non-neoplastic mucosa. The densitometry value for PPARα and Bcl-2, referred to the corresponding β-actin value, was compared with that of the corresponding non-neoplastic mucosa, taken as 1. The data are expressed in means ± SD. Since COX-2 was not expressed in all mucosa specimens, the same comparative data as for PPARα is not available. Significant differences between cancer specimens and relative mucosa specimens were assessed by the Wilcoxon signed rank test (*P < .05). Significant differences among cancer groups at different Duke's stages were assessed by variance analysis followed by the post hoc Newman-Keuls test. C+: positive control.

