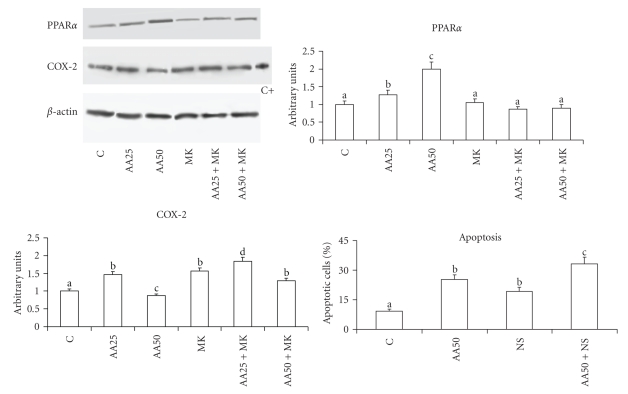
Figure 6.
Protein content of PPARα and COX-2 and percentage of cells in apoptosis in human Caco-2 cells 48 hours after enrichment with arachidonic acid and COX-2 inhibitor NS398. Data are expressed in means ± SD of 3 experiments. For COX-2 and for apoptosis means with different letters are significantly different from one another (P < .05), as determined by variance analysis followed by post hoc Newman-Keuls test. For PPARα and COX-2, the densitometry values, referred to as the corresponding β-actin value, was compared with those of control cells, taken as 1. C: control cells; AA25: cells treated with 25 μM arachidonic acid; AA50: cells treated with 50 μM arachidonic acid; MK: cells treated with 2 μM MK886. For percentage of cells in apoptosis, C: control cells; AA50: cells treated with 50 μM arachidonic acid; NS: cells treated with 50 μM NS398; AA50 + NS: cells treated with 50 μM arachidonic acid plus 50 μM NS398.

