
Figure 6. In vivo and in silico elongation of cell-cell junctions by migrating tip cells.

(A) Confocal image of two tip cells (blue - isolectin B4 staining) in the mouse retina, stretching the stalk cell between them (green - Transgenic Notch Reporter signal eGFP), and significantly elongating the junction (highlighted in white).  (B) This morphology, where a thin edge of the stalk cell lines the tip cell, is matched in simulation due to the low mesh spring constant. Tip cells - pink, stalk cells - purple, junction springs: white. (C) Diagram showing the vessel divided into segments to give two cells per cross section. A single offset parameter defines the position of the segments two cells. The offset runs from
  , where zero divides them along the top of the vessel as indicated by the dotted line. Here the offsets are, in order of segments,
 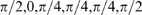 . Having three equal offsets in a row leads the central cells (indicated by an arrow) to have only three neighbours whereas the cells in the outer segments will have five neighbours.