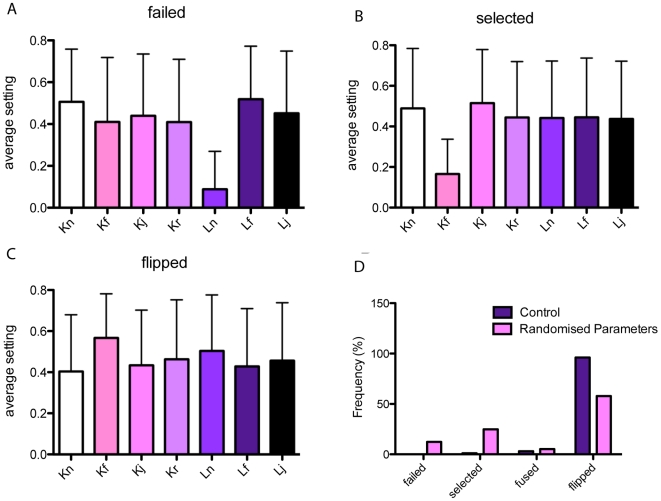
Figure 11. Spring constant sensitivity analysis results.
The average setting for each spring parameter when the four stages of development are achieved by the final time step, see Table 1. (A) runs that failed to achieve a salt and pepper pattern noticeably have very low  values. (B) runs that selected tip cells but did not fuse had very low
  values, (C) runs where tip cells fused and one flipped fate show robustness to most parameter settings as long as the previously mentioned constants were set high. (D) Comparing the frequency of each possible outcome against runs with the parameter settings used in all other simulations, detailed in Table 1, which almost always show a flip in fate and never fail to select the salt and pepper pattern.

