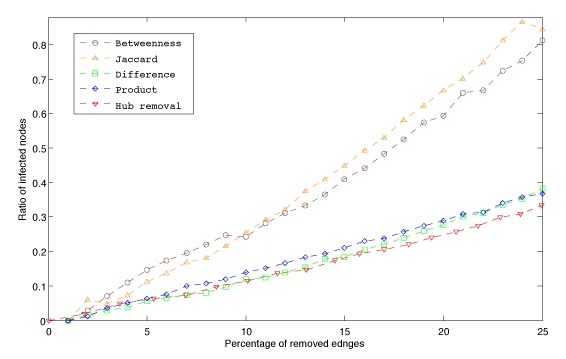
Figure 2. Spreading time versus sequential edge elimination by betweenness centrality, Jaccard coefficient, difference and product of degrees and by hub removal (see Methods). For example, a 0.8 ratio indicates that spreading took 80\% longer than the intact case after the corresponding percentage of edges were removed.

