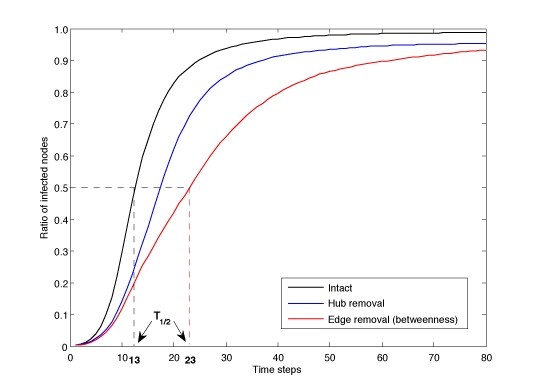
Figure 4. Spreading for Mexico City as starting node, measured by the ratio of infected nodes on the intact network (black) and after removing 25% of edges by hub removal (blue) or edge betweenness (red). T1/2 represents the time step where half of the nodes are infected.

