Figure 1.
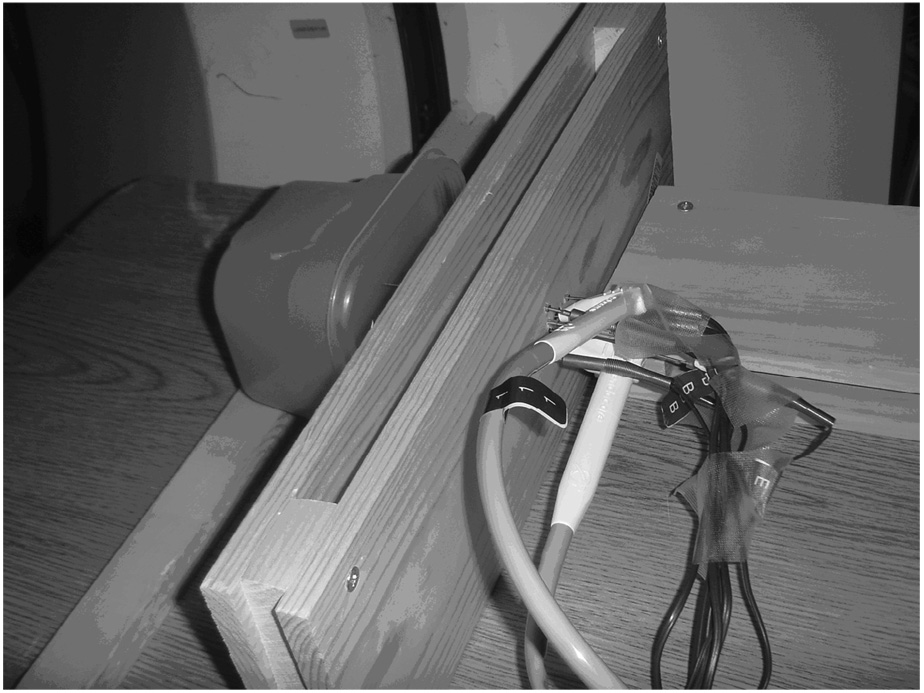
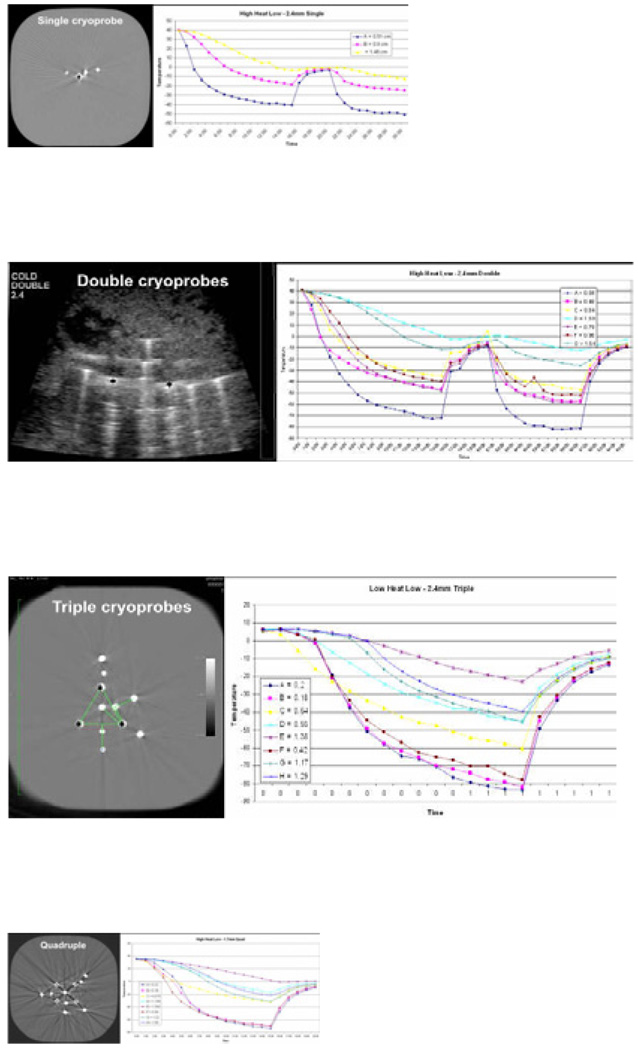
Phantom set up within CT scanner gantry (a) and associated images of the single (b), double (c), triple (d) and quadruple cryoprobe (e) arrangements showing thermocouples radially surrounding the cryoprobes at 0.5 1.0 and 1.5 cm, as well as extending outward along a perpendicular line between the cryoprobes. Companion temperature graphs are shown for each configuration but only the single and double are shown with a freeze:thaw:freeze cycle obtained in the highest heat load phantoms (39°C). Despite the lack of any physiologic warming during the thaw phase, temperature curves still show rapid re-cooling of the ablation volume due to the 4-fold greater conductivity of ice during the second freeze (20).


