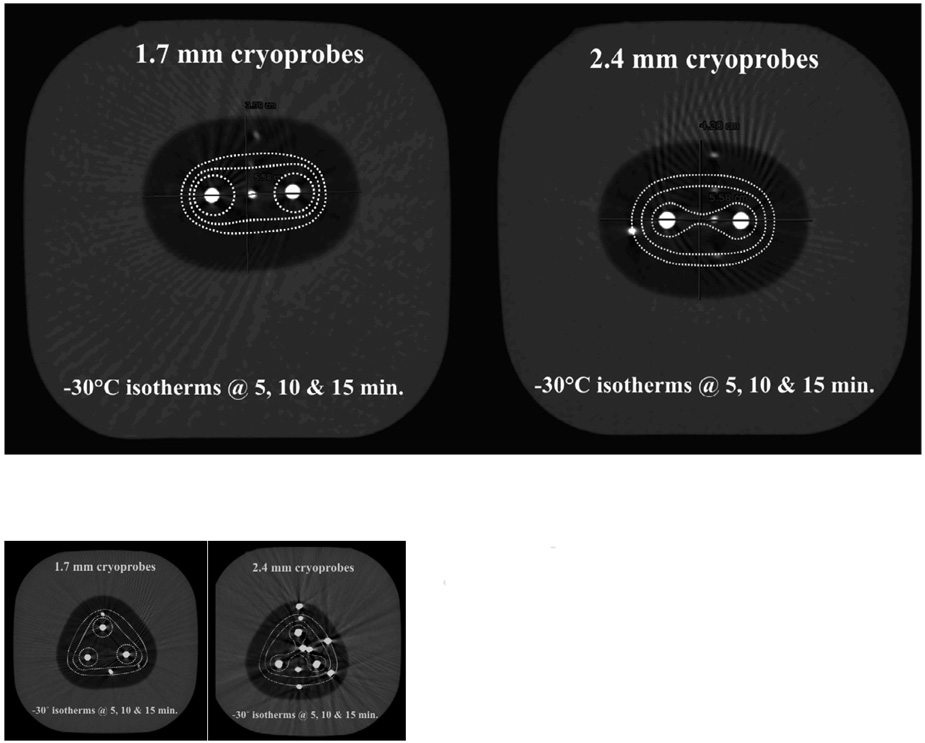
Progression of the lethal isotherm (−30°C) at 5 (dashed white lines), 10 (dashed pink lines) and 15 (dashed red lines) minutes is shown for double and triple configurations of 1.7 and 2.4 mm cryoprobes, overlaid upon the CT image for the total ice appearance at 15 minutes.
Figure 5a shows that lethal ice surface area grows more for 2.4mm cryoprobes (right) after 5 minutes due to early synergy than for 1.7 mm cryoprobes (left):
|
Lethal zones:1.7 mm cryoprobes (cm2) |
2.4 mm cryoprobes (cm2) |
| 1.0 |
1.1 |
5 min. |
| 2.5 |
5.6 |
10 min. |
| 4.1 |
8.1 |
15 min. |
Figure 5b shows that lethal ice surface area grows more for 2.4mm cryoprobes (right) after 5 minutes due to early synergy but the difference becomes less over time once synergy also occurs for 1.7 mm cryoprobes (left):
|
Lethal zones:1.7 mm cryoprobes (cm2) |
2.4 mm cryoprobes (cm2) |
| 1.3 |
3.4 |
5 min. |
| 7.0 |
9.0 |
10 min. |
| 9.9 |
13.0 |
15 min. |

