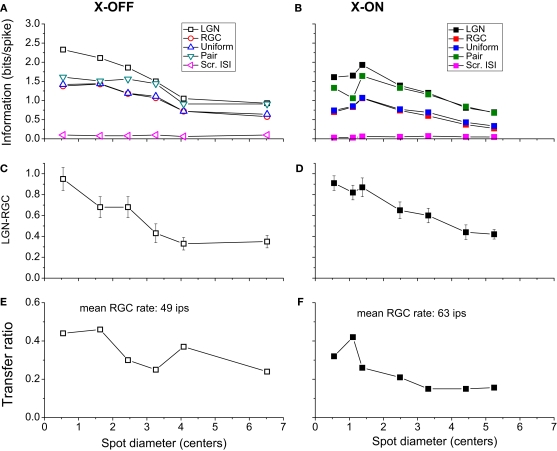
Figure 2.
The relation between information transmission and stimulus size. (A,B) Single spike information (in bits/spike) as a function of spot size for two representative cells (# 7 and 8, Table 1). The LGN spike train (black) carries more information per spike than the corresponding RGC spike train (red). For comparison, we have included the results of three different deletion procedures, which left the number of LGN spikes the same as it was in the real one: random deletion of events from the RGC spike train (green), considering only pairs of RGC spikes (blue) and a spike train generated by scrambling the interspike intervals in the observed LGN train (magenta). (C,D) The difference between the information (in bits/spike) between the LGN and the RGC. The error bars are the sums of the standard errors of the mean for the LGN and RGC. (E,F) Transfer ratio (LGN firing rate divided by RGC firing rate) as a function of spot diameter. To facilitate comparison between cells of different RF center size, spot diameter is given in multiples of the diameter of the RF center (see Materials and Methods).

