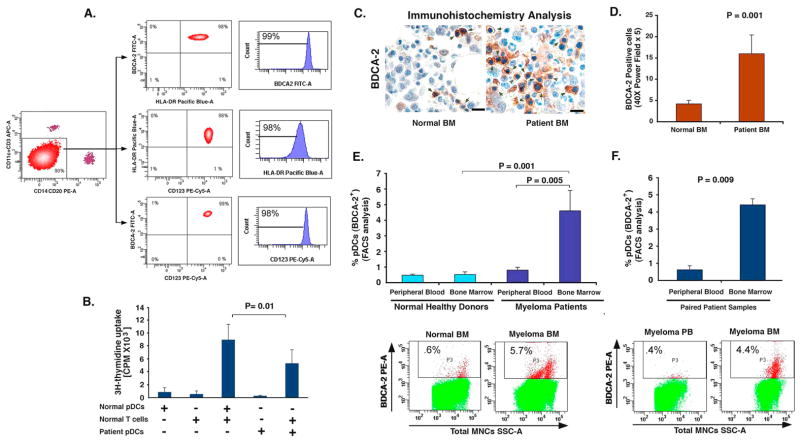
Figure 1. Distribution and frequency of pDCs.
(A) Total MNCs were subjected to BDCA-4 positive selection using two step purification, and then labeled with CD123 PE-Cy5, HLA-DR Pacific Blue, BDCA-2 FITC, CD14-PE, CD20 PE, CD11c and CD3 APC antibodies. Lin-, and CD11c- (90%) cells were gated and FACS sorted. Analysis of this cell population showed 99% BDCA-2+, 98% HLA-DR+, and 98% CD123+ cells. (B) DNA synthesis in allogeneic T cells stimulated by pDCs from healthy donors and MM patients (mean ± SD; n=4). (C) IHC analysis on normal donor BM and MM patient BM biopsies was performed using BDCA-2 Ab. Arrows indicate brown BDCA-2-positive pDCs. Micrographs are representative from 10 MM patients and 5 normal donors. Scale bars, 10 μM. (D) Quantification of BDCA-2-positive pDCs in MM BM vs. normal BM from C. The pDC frequency was quantified by selecting 5 random independent high power (X40) microscopic fields for each tissue sample. (E) Quantification of pDCs from normal donors PB and BM vs. MM patient PB and BM by FACS using BDCA-2-PE conjugated Ab. Upper panel: Data shown is derived from analysis of 32 MM patients and 8 normal donors. Lower panel: A representative FACS analysis showing higher percentage of BDCA-2-positive pDCs in MM BM vs. normal BM. (F) Upper panel: Quantification of pDCs from matched paired samples of 8 MM patient PB and BM by FACS using BDCA-2 Ab. Lower panel: A representative FACS analysis from 8 patients analyzed is shown. Error bars indicate standard deviation (SD).

