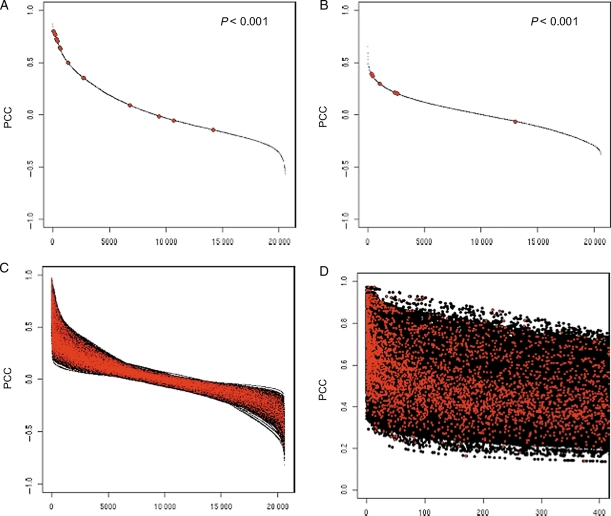
Figure 2.
Relationships of PCC values and GO term agreement. Decay curves of PCC values for gene coexpression are shown for Arabidopsis genes. Decay curves of PCC values of coexpressed genes from two particular genes: At3g20000 (A) and At5g06140 (B). Red dots indicate genes that have the same annotations of GO BP terms as the reference gene. Statistical significance of non-random distribution of the red dots was established by the Kolmogorov–Smirnov test. (C) The same curves in A and B are overlaid for all Arabidopsis genes. (D) Detailed view of the 0–400 range of C.

