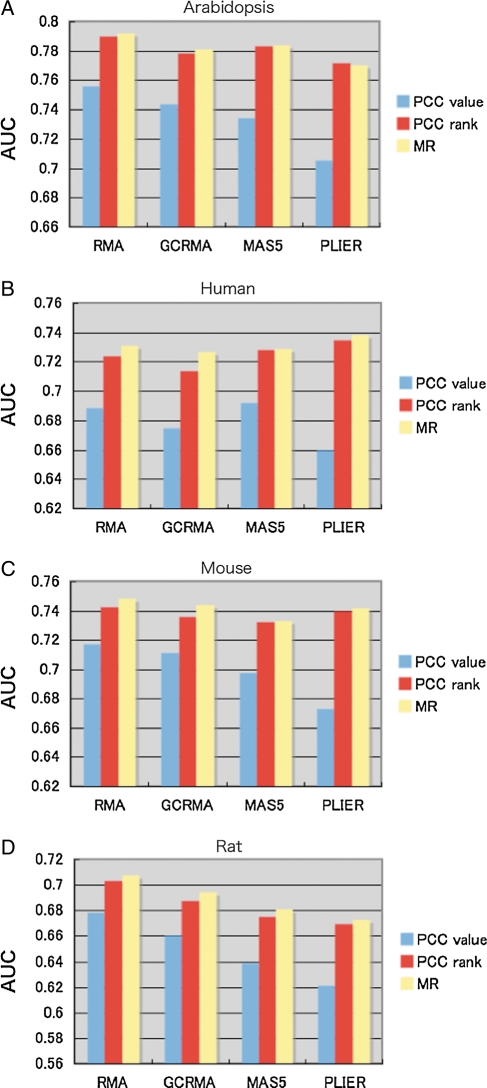
Figure 5.
Effect of summarization methods for GO predictions. The four types of summarization methods were assessed for their ability to predict GO annotations. The y-axes indicate average AUC values of the ROC curves to predict GO BP, CC and MF. Note that the AUCs on the y-axis do not start from 0.5, which corresponds to random prediction, because we focused on differences of AUCs rather than the absolute value of AUCs.

