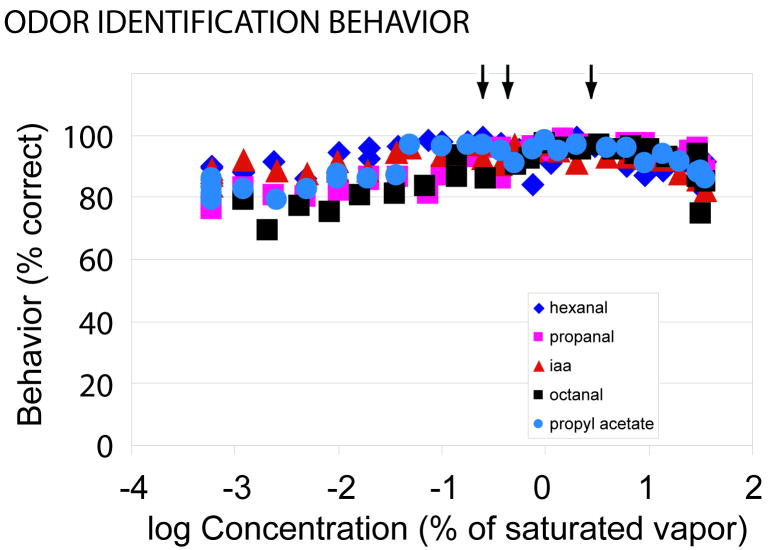
FIG. 1.
Percent correct odor identification as versus odorant concentration. At all tested concentrations the percent correct was far above random chance (20%). Five odorants were tested. Each data point is the average result from six animals. For the data points the range of the Standard Error of the Means (SEM) was between 0.5% and 13%; for most data points the SEM error bar would be smaller than the symbol. The left arrow indicates the training concentration for isoamyl acetate and propanal; the middle arrow indicates the training concentration for propyl acetate and hexanal; the right arrow indicates the training concentration for octanal.

