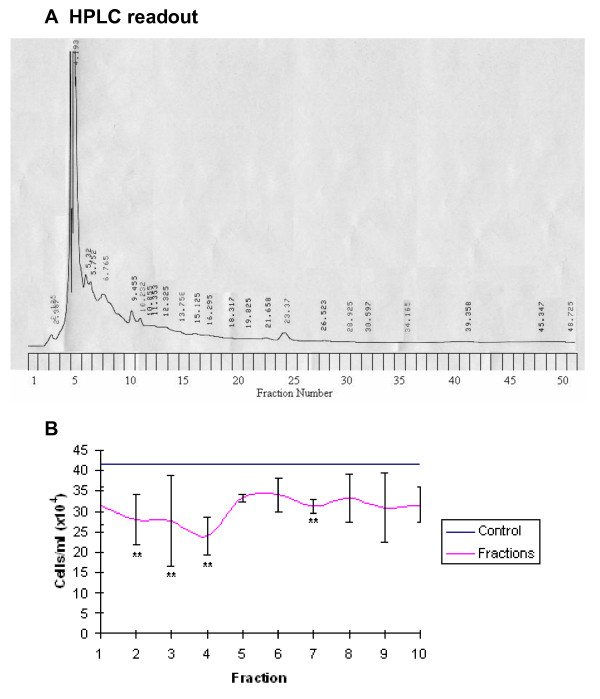
Figure 11.
A: HPLC readout (253 nm) of LD eluted at 3 ml/minute with the corresponding fraction number labelled on the y axis. (Repeat analysis). 11B: the growth inhibitory effect of each fraction on the HL60 cell line after 48 hours of exposure. The pink line represents control cell growth, the blue line represents the number of cells/ml after 48 hours of exposure to CHR ± standard deviation form the mean, * and ** denote statistical significance p = 0.05 and p = 0.01 respectively. (Repeat experiment)

