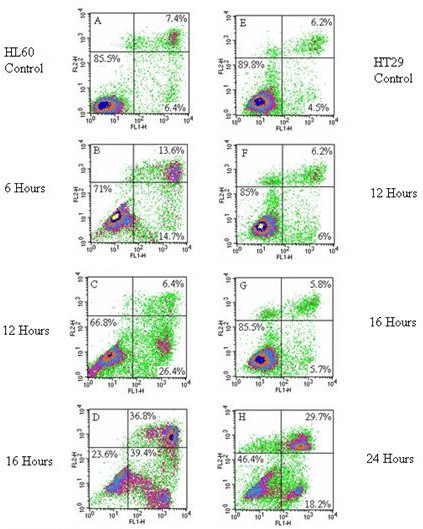
Figure 2.

A-H: Annexin V staining of HL60 and HT29 cell lines exposed to the water extract of LD at 1:10. The x-axis shows Annexin V-FITC binding and the y-axis staining of the vital dye propidium iodide. Cells in the lower left quadrant are viable, cells in the lower right are apoptotic and those in the upper right are non-viable dead/late stage apoptotic cells. 2A: HL60 control, 2B: HL60 cells exposed to LD (1:10) for 6 hrs, 2C: HL60 cells exposed to LD (1:10) for 12 hours, 2D: HL60 cells exposed to LD (1:10) for 16 hours, 2E: HT29 cells control, 2F: HT29 cells exposed to LD (1:10) for 12 hours, 2G: HT29 cells exposed to LD (1:10) for 16 hours, 2H: HT29 cells exposed to LD (1:10) for 24 hours.
