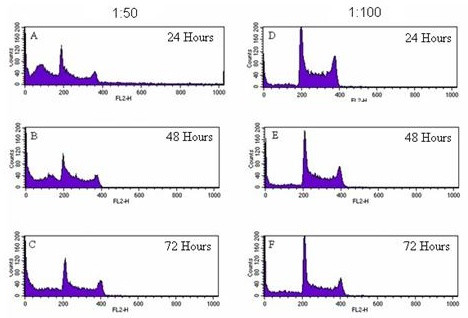
Figure 5.

A-F: Cell cycle histograms of HL60 cells exposed to LD at 1:50 and 1:100. The peak in channel 200 shows cells in G1, and the peak in 400 cells in G2 of the cell cycle. The Sub-G1 region is apoptotic cells. 5A-5C show the effects of a LD at 1:50 on cell cycle characteristics after 24, 48 and 72 hours, respectively. 5D-5F show the effects of a 1:100 extract after 24, 48 and 72 hours, respectively.
