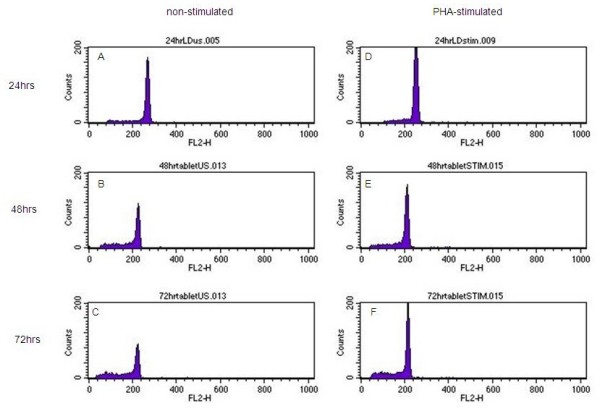
Figure 9.

A-F: Histograms showing PI stained non-stimulated and PHA-stimulated PBLs exposed to LD at 1:10 for 24, 48 and 72 hours. The x axis of each histogram shows relative DNA content, with cells in G0/G1 over channel 200. The sub-G1 region represents apoptotic cells. The y axis represents cell number. 9A: non stimulated PBLs exposed to LD (1:10) for 24 hours, 9B: non stimulated PBLs exposed to LD (1:10) for 48 hours, 9C: non stimulated PBLs exposed to LD (1:10) for 72 hrs, 9D: PHA stimulated PBLS exposed to LD (1:10) for 24 hours, 9E: PHA stimulated PBLS exposed to LD (1:10) for 48 hours, 9F: PHA stimulated PBLS exposed to LD (1:10) for 72 hours.
