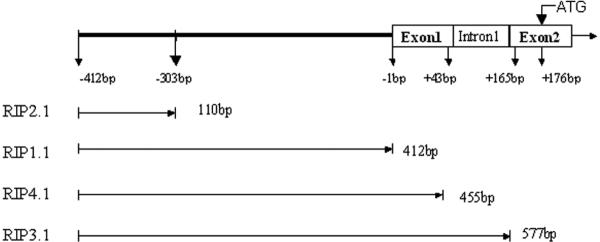
Figure 1.
Schematic representation of the rat insulin promoter, including exon1, intron1 and exon2. RIPA2.1 contains only part of the promoter; RIPB1.1 is the full-length rat insulin promoter; RIPC4.1 includes promoter region plus exon 1; RIPD3.1 includes promoter, exon 1, intron 1 and the first three bases of exon 2.

