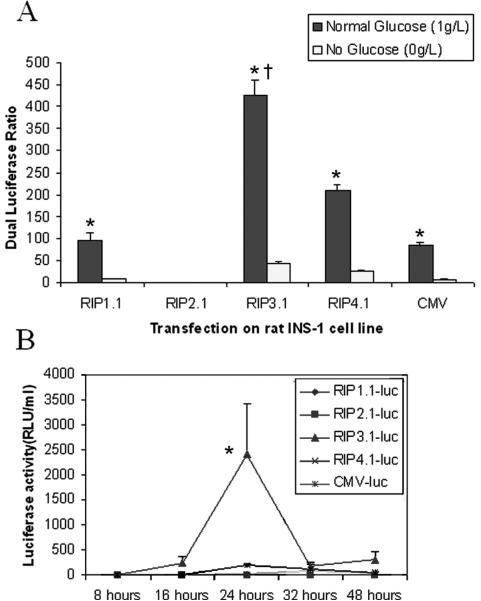
Figure 2.
Top Panel. Dual luciferase ratio of INS-1 cells lysates 48 hours after transfection with RIP-luc. Black bars indicate normal glucose concentration. White bars indicate no glucose. * p<0.001 vs no glucose; † p<0.001 vs all other promoters. Bottom panel. Luciferase activity of culture media solution at various times after transfection with RIP-luc with glucose. * p<0.0001 vs all other groups and timepoints.

