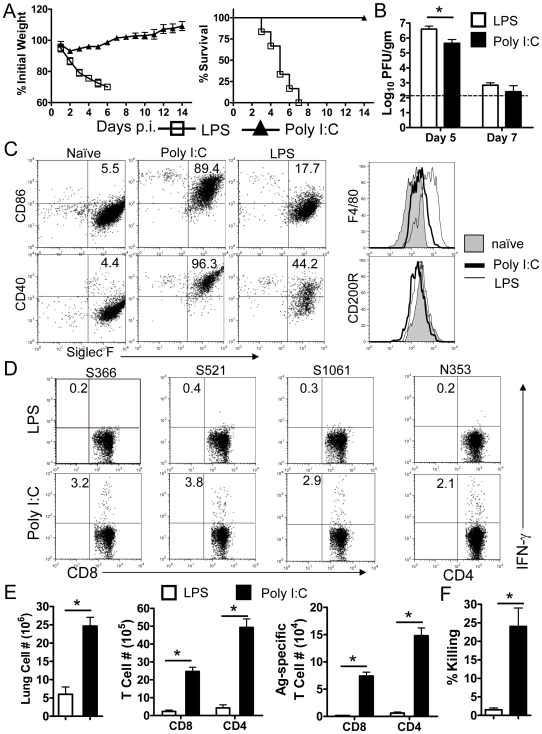
Figure 5. Protective effects of poly I:C treatment.
(A) Mice were treated with 20 µg poly I:C or 5 µg LPS 18–24 h before infection with MA15. Weight loss and mortality were monitored daily. n = 18 in LPS group; 14 mice in Poly I:C group. (B) Lungs were harvested and homogenized and virus was titered on Vero E6 cells. Viral titers are expressed as PFU/g tissue. (n = 4 mice/group/time point). (C) Single cell suspensions were prepared from lungs of naïve and treated mice. CD86, CD40. F4/80 and CD200R expression by CD11c+CD11b−Siglec F+ AMs after poly I:C, LPS or no treatment was determined by flow cytometry. The frequencies of MHC II+ CD86+ cell populations are shown. (D and E) Mice were treated with poly I:C or LPS 18–24 h prior to MA15 infection. At day 7 p.i., single cell suspensions were prepared from lungs, and stimulated with SARS-CoV CD8 (S366, S521 and S1061) or CD4 (N353) T cell peptides for 6 h in the presence of brefeldin A. Cells were analyzed for IFN-γ expression. Frequency (D) and numbers (E) of virus specific T cells are shown. Data are representative of two independent experiments and are the mean values±SEM (n = 5–8 mice/group/time point). (F) In vivo cytotoxicity assays were performed on day 6 p.i. Target cells were co-stained with PKH26 and different concentrations of CSFE, then pulsed with/without SARS-CoV specific CD8 T cell peptides, mixed together (1×10⁶ in total) and transferred i.n. to mice. 12 h after transfer, lung cells were examined by flow cytometry. n = 3–4 mice/group. Data are representative of two independent experiments.

