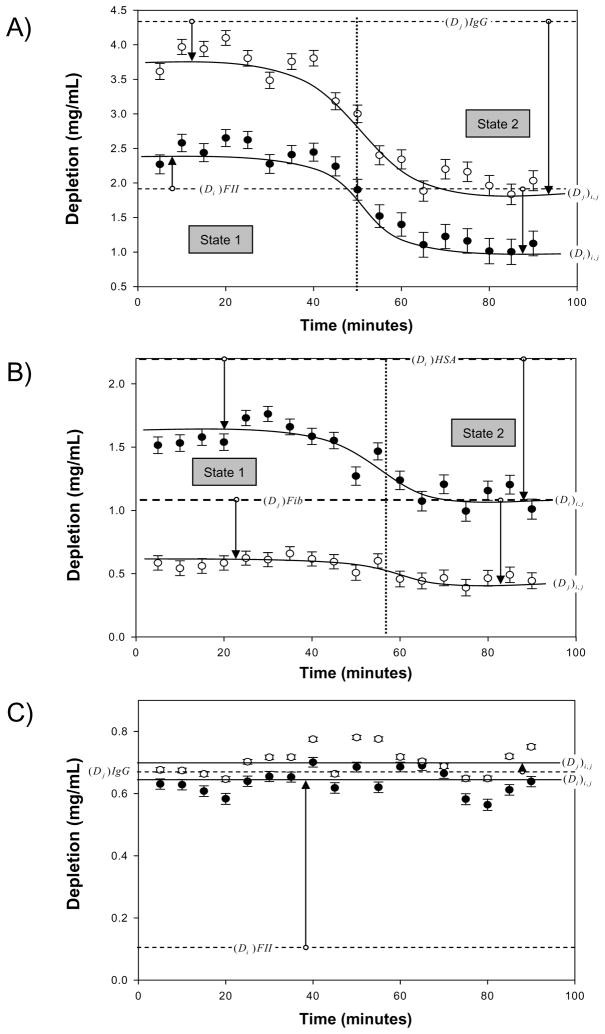
Figure 1.
Adsorption-competition kinetic profiles plotting amount of proteins i and j adsorbed to the same hydrophobic octyl sepharose (OS) adsorbent from stagnant binary-protein solutions. Similar adsorption-competition outcomes were observed for octadecyltrichlorosilane treated glass particles (OTS). Adsorption is measured as solution depletion (Di)i,j and (Dj)i,j (see text for nomenclature). Simultaneous adsorption competition between i, j proteins exhibit different kinetic profiles that depend on relative competing-protein size (molecular weight) and relative solution concentration (see Tables 2A,B). Panel A (i = FII and j = IgG) and Panel B (i = HSA and j = Fib) illustrate experimental circumstances (Cases 5 and 3, see Section 3.2) wherein two pseudo-steady-state adsorption regimes (State 1 and State 2) were observed (solid lines are guides to the eye). State 1 and State 2 were connected by a smooth transition lasting for 20 to 30 minutes (vertical dotted lines note the approximate half-maximum transition time). The State 1 → State 2 transition for HSA in Panel B was just detectable above experimental uncertainty. Panel C (i = FII and j = IgG) illustrates an experimental circumstance (Case 1) where only a single steady-state adsorption of both i, j proteins were observed. For comparison, dashed horizontal lines indicate the depletion Di or Dj adsorbing from a single-protein solution at the concentration used in the binary competition experiment. Vertical arrows indicate loss or gain of adsorption in binary competition compared to adsorption from single-protein solution.

